Deprecated: Using ${var} in strings is deprecated, use {$var} instead in
/home/devwp/public_html/p225-newweb/wp-content/themes/vsceptre/includes/builder/module/settings/migration/ColumnOptions.php on line
95
Deprecated: Using ${var} in strings is deprecated, use {$var} instead in
/home/devwp/public_html/p225-newweb/wp-content/themes/vsceptre/includes/builder/module/settings/migration/ColumnOptions.php on line
95
Deprecated: Using ${var} in strings is deprecated, use {$var} instead in
/home/devwp/public_html/p225-newweb/wp-content/themes/vsceptre/includes/builder/module/settings/migration/ColumnOptions.php on line
97
Deprecated: Using ${var} in strings is deprecated, use {$var} instead in
/home/devwp/public_html/p225-newweb/wp-content/themes/vsceptre/includes/builder/module/settings/migration/ColumnOptions.php on line
97
Deprecated: Using ${var} in strings is deprecated, use {$var} instead in
/home/devwp/public_html/p225-newweb/wp-content/themes/vsceptre/includes/builder/module/settings/migration/ColumnOptions.php on line
103
Deprecated: Using ${var} in strings is deprecated, use {$var} instead in
/home/devwp/public_html/p225-newweb/wp-content/themes/vsceptre/includes/builder/module/settings/migration/ColumnOptions.php on line
103
Deprecated: Using ${var} in strings is deprecated, use {$var} instead in
/home/devwp/public_html/p225-newweb/wp-content/themes/vsceptre/includes/builder/module/settings/migration/ColumnOptions.php on line
105
Deprecated: Using ${var} in strings is deprecated, use {$var} instead in
/home/devwp/public_html/p225-newweb/wp-content/themes/vsceptre/includes/builder/module/settings/migration/ColumnOptions.php on line
105
Deprecated: Using ${var} in strings is deprecated, use {$var} instead in
/home/devwp/public_html/p225-newweb/wp-content/themes/vsceptre/includes/builder/module/settings/migration/ColumnOptions.php on line
130
Deprecated: Using ${var} in strings is deprecated, use {$var} instead in
/home/devwp/public_html/p225-newweb/wp-content/themes/vsceptre/includes/builder/module/settings/migration/ColumnOptions.php on line
130
Deprecated: Using ${var} in strings is deprecated, use {$var} instead in
/home/devwp/public_html/p225-newweb/wp-content/themes/vsceptre/includes/builder/module/settings/migration/ColumnOptions.php on line
132
Deprecated: Using ${var} in strings is deprecated, use {$var} instead in
/home/devwp/public_html/p225-newweb/wp-content/themes/vsceptre/includes/builder/module/settings/migration/ColumnOptions.php on line
132
Deprecated: Using ${var} in strings is deprecated, use {$var} instead in
/home/devwp/public_html/p225-newweb/wp-content/themes/vsceptre/includes/builder/module/settings/migration/ColumnOptions.php on line
161
Deprecated: Using ${var} in strings is deprecated, use {$var} instead in
/home/devwp/public_html/p225-newweb/wp-content/themes/vsceptre/includes/builder/module/settings/migration/ColumnOptions.php on line
161
Deprecated: Using ${var} in strings is deprecated, use {$var} instead in
/home/devwp/public_html/p225-newweb/wp-content/themes/vsceptre/includes/builder/module/settings/migration/ColumnOptions.php on line
161
Deprecated: Using ${var} in strings is deprecated, use {$var} instead in
/home/devwp/public_html/p225-newweb/wp-content/themes/vsceptre/includes/builder/module/settings/migration/ColumnOptions.php on line
162
Deprecated: Using ${var} in strings is deprecated, use {$var} instead in
/home/devwp/public_html/p225-newweb/wp-content/themes/vsceptre/includes/builder/module/settings/migration/ColumnOptions.php on line
162
Deprecated: Using ${var} in strings is deprecated, use {$var} instead in
/home/devwp/public_html/p225-newweb/wp-content/themes/vsceptre/includes/builder/module/settings/migration/ColumnOptions.php on line
162
Deprecated: Using ${var} in strings is deprecated, use {$var} instead in
/home/devwp/public_html/p225-newweb/wp-content/themes/vsceptre/includes/builder/module/settings/migration/ColumnOptions.php on line
205
Deprecated: Using ${var} in strings is deprecated, use {$var} instead in
/home/devwp/public_html/p225-newweb/wp-content/themes/vsceptre/includes/builder/module/settings/migration/ColumnOptions.php on line
205
Deprecated: Using ${var} in strings is deprecated, use {$var} instead in
/home/devwp/public_html/p225-newweb/wp-content/themes/vsceptre/includes/builder/module/settings/migration/ColumnOptions.php on line
205
Deprecated: Using ${var} in strings is deprecated, use {$var} instead in
/home/devwp/public_html/p225-newweb/wp-content/themes/vsceptre/includes/builder/module/settings/migration/ColumnOptions.php on line
205
Deprecated: Using ${var} in strings is deprecated, use {$var} instead in
/home/devwp/public_html/p225-newweb/wp-content/themes/vsceptre/includes/builder/module/settings/migration/ColumnOptions.php on line
207
Deprecated: Using ${var} in strings is deprecated, use {$var} instead in
/home/devwp/public_html/p225-newweb/wp-content/themes/vsceptre/includes/builder/module/settings/migration/ColumnOptions.php on line
207
Deprecated: Using ${var} in strings is deprecated, use {$var} instead in
/home/devwp/public_html/p225-newweb/wp-content/themes/vsceptre/includes/builder/module/settings/migration/ColumnOptions.php on line
207
Deprecated: Creation of dynamic property ET_Builder_Section::$_original_content is deprecated in
/home/devwp/public_html/p225-newweb/wp-content/themes/vsceptre/includes/builder/class-et-builder-element.php on line
1315
Deprecated: Creation of dynamic property ET_Builder_Module_Helper_MultiViewOptions::$inherited_props is deprecated in
/home/devwp/public_html/p225-newweb/wp-content/themes/vsceptre/includes/builder/module/helpers/MultiViewOptions.php on line
686
Deprecated: Creation of dynamic property ET_Builder_Module_Field_Divider::$count is deprecated in
/home/devwp/public_html/p225-newweb/wp-content/themes/vsceptre/includes/builder/main-structure-elements.php on line
1498
Deprecated: Creation of dynamic property ET_Builder_Row::$_original_content is deprecated in
/home/devwp/public_html/p225-newweb/wp-content/themes/vsceptre/includes/builder/class-et-builder-element.php on line
1315
Deprecated: Creation of dynamic property ET_Builder_Column::$_original_content is deprecated in
/home/devwp/public_html/p225-newweb/wp-content/themes/vsceptre/includes/builder/class-et-builder-element.php on line
1315
Deprecated: Creation of dynamic property ET_Builder_Module_Text::$text_shadow is deprecated in
/home/devwp/public_html/p225-newweb/wp-content/themes/vsceptre/includes/builder/class-et-builder-element.php on line
1315
Deprecated: Creation of dynamic property ET_Builder_Module_Text::$margin_padding is deprecated in
/home/devwp/public_html/p225-newweb/wp-content/themes/vsceptre/includes/builder/class-et-builder-element.php on line
1315
Deprecated: Creation of dynamic property ET_Builder_Module_Text::$_additional_fields_options is deprecated in
/home/devwp/public_html/p225-newweb/wp-content/themes/vsceptre/includes/builder/class-et-builder-element.php on line
1315
Deprecated: Creation of dynamic property ET_Builder_Module_Text::$_original_content is deprecated in
/home/devwp/public_html/p225-newweb/wp-content/themes/vsceptre/includes/builder/class-et-builder-element.php on line
1315
Deprecated: Creation of dynamic property ET_Builder_Module_Helper_MultiViewOptions::$inherited_props is deprecated in
/home/devwp/public_html/p225-newweb/wp-content/themes/vsceptre/includes/builder/module/helpers/MultiViewOptions.php on line
686
Deprecated: Creation of dynamic property ET_Builder_Module_Menu::$text_shadow is deprecated in
/home/devwp/public_html/p225-newweb/wp-content/themes/vsceptre/includes/builder/class-et-builder-element.php on line
1315
Deprecated: Creation of dynamic property ET_Builder_Module_Menu::$margin_padding is deprecated in
/home/devwp/public_html/p225-newweb/wp-content/themes/vsceptre/includes/builder/class-et-builder-element.php on line
1315
Deprecated: Creation of dynamic property ET_Builder_Module_Menu::$_additional_fields_options is deprecated in
/home/devwp/public_html/p225-newweb/wp-content/themes/vsceptre/includes/builder/class-et-builder-element.php on line
1315
Deprecated: Creation of dynamic property ET_Builder_Module_Menu::$_original_content is deprecated in
/home/devwp/public_html/p225-newweb/wp-content/themes/vsceptre/includes/builder/class-et-builder-element.php on line
1315
Deprecated: Creation of dynamic property WPML_LS_Menu_Item::$current is deprecated in
/home/devwp/public_html/p225-newweb/wp-includes/nav-menu-template.php on line
399
Deprecated: Creation of dynamic property WPML_LS_Menu_Item::$current is deprecated in
/home/devwp/public_html/p225-newweb/wp-includes/nav-menu-template.php on line
399
Deprecated: Creation of dynamic property WPML_LS_Menu_Item::$current is deprecated in
/home/devwp/public_html/p225-newweb/wp-includes/nav-menu-template.php on line
399
Deprecated: Creation of dynamic property WPML_LS_Menu_Item::$current_item_ancestor is deprecated in
/home/devwp/public_html/p225-newweb/wp-includes/nav-menu-template.php on line
545
Deprecated: Creation of dynamic property WPML_LS_Menu_Item::$current_item_parent is deprecated in
/home/devwp/public_html/p225-newweb/wp-includes/nav-menu-template.php on line
546
Deprecated: Creation of dynamic property ET_Builder_Module_Helper_MultiViewOptions::$inherited_props is deprecated in
/home/devwp/public_html/p225-newweb/wp-content/themes/vsceptre/includes/builder/module/helpers/MultiViewOptions.php on line
686
Deprecated: Creation of dynamic property ET_Builder_Module_Helper_MultiViewOptions::$inherited_props is deprecated in
/home/devwp/public_html/p225-newweb/wp-content/themes/vsceptre/includes/builder/module/helpers/MultiViewOptions.php on line
686
Deprecated: Creation of dynamic property ET_Builder_Module_Helper_MultiViewOptions::$inherited_props is deprecated in
/home/devwp/public_html/p225-newweb/wp-content/themes/vsceptre/includes/builder/module/helpers/MultiViewOptions.php on line
686
Deprecated: Creation of dynamic property ET_Builder_Module_Search::$text_shadow is deprecated in
/home/devwp/public_html/p225-newweb/wp-content/themes/vsceptre/includes/builder/class-et-builder-element.php on line
1315
Deprecated: Creation of dynamic property ET_Builder_Module_Search::$margin_padding is deprecated in
/home/devwp/public_html/p225-newweb/wp-content/themes/vsceptre/includes/builder/class-et-builder-element.php on line
1315
Deprecated: Creation of dynamic property ET_Builder_Module_Search::$_additional_fields_options is deprecated in
/home/devwp/public_html/p225-newweb/wp-content/themes/vsceptre/includes/builder/class-et-builder-element.php on line
1315
Deprecated: Creation of dynamic property ET_Builder_Module_Image::$text_shadow is deprecated in
/home/devwp/public_html/p225-newweb/wp-content/themes/vsceptre/includes/builder/class-et-builder-element.php on line
1315
Deprecated: Creation of dynamic property ET_Builder_Module_Image::$margin_padding is deprecated in
/home/devwp/public_html/p225-newweb/wp-content/themes/vsceptre/includes/builder/class-et-builder-element.php on line
1315
Deprecated: Creation of dynamic property ET_Builder_Module_Image::$_additional_fields_options is deprecated in
/home/devwp/public_html/p225-newweb/wp-content/themes/vsceptre/includes/builder/class-et-builder-element.php on line
1315
Deprecated: Creation of dynamic property ET_Builder_Module_Image::$_original_content is deprecated in
/home/devwp/public_html/p225-newweb/wp-content/themes/vsceptre/includes/builder/class-et-builder-element.php on line
1315
Deprecated: Creation of dynamic property ET_Builder_Module_Helper_MultiViewOptions::$inherited_props is deprecated in
/home/devwp/public_html/p225-newweb/wp-content/themes/vsceptre/includes/builder/module/helpers/MultiViewOptions.php on line
686
Deprecated: Creation of dynamic property ET_Builder_Module_Helper_MultiViewOptions::$inherited_props is deprecated in
/home/devwp/public_html/p225-newweb/wp-content/themes/vsceptre/includes/builder/module/helpers/MultiViewOptions.php on line
686
Deprecated: Creation of dynamic property ET_Builder_Module_Helper_MultiViewOptions::$inherited_props is deprecated in
/home/devwp/public_html/p225-newweb/wp-content/themes/vsceptre/includes/builder/module/helpers/MultiViewOptions.php on line
686
Deprecated: Creation of dynamic property ET_Builder_Module_Helper_MultiViewOptions::$inherited_props is deprecated in
/home/devwp/public_html/p225-newweb/wp-content/themes/vsceptre/includes/builder/module/helpers/MultiViewOptions.php on line
686
Deprecated: Creation of dynamic property ET_Builder_Module_Helper_MultiViewOptions::$inherited_props is deprecated in
/home/devwp/public_html/p225-newweb/wp-content/themes/vsceptre/includes/builder/module/helpers/MultiViewOptions.php on line
686
Deprecated: Creation of dynamic property ET_Builder_Module_Search::$_original_content is deprecated in
/home/devwp/public_html/p225-newweb/wp-content/themes/vsceptre/includes/builder/class-et-builder-element.php on line
1315
Deprecated: Creation of dynamic property ET_Builder_Module_Helper_MultiViewOptions::$inherited_props is deprecated in
/home/devwp/public_html/p225-newweb/wp-content/themes/vsceptre/includes/builder/module/helpers/MultiViewOptions.php on line
686
Deprecated: Creation of dynamic property ET_Builder_Module_Helper_MultiViewOptions::$inherited_props is deprecated in
/home/devwp/public_html/p225-newweb/wp-content/themes/vsceptre/includes/builder/module/helpers/MultiViewOptions.php on line
686
Deprecated: Creation of dynamic property ET_Builder_Module_Helper_MultiViewOptions::$inherited_props is deprecated in
/home/devwp/public_html/p225-newweb/wp-content/themes/vsceptre/includes/builder/module/helpers/MultiViewOptions.php on line
686
Deprecated: Creation of dynamic property ET_Builder_Module_Helper_MultiViewOptions::$inherited_props is deprecated in
/home/devwp/public_html/p225-newweb/wp-content/themes/vsceptre/includes/builder/module/helpers/MultiViewOptions.php on line
686
Deprecated: Creation of dynamic property ET_Builder_Module_Helper_MultiViewOptions::$inherited_props is deprecated in
/home/devwp/public_html/p225-newweb/wp-content/themes/vsceptre/includes/builder/module/helpers/MultiViewOptions.php on line
686
Deprecated: Creation of dynamic property ET_Builder_Module_Helper_MultiViewOptions::$inherited_props is deprecated in
/home/devwp/public_html/p225-newweb/wp-content/themes/vsceptre/includes/builder/module/helpers/MultiViewOptions.php on line
686
Deprecated: Creation of dynamic property WPML_LS_Menu_Item::$current is deprecated in
/home/devwp/public_html/p225-newweb/wp-includes/nav-menu-template.php on line
399
Deprecated: Creation of dynamic property WPML_LS_Menu_Item::$current is deprecated in
/home/devwp/public_html/p225-newweb/wp-includes/nav-menu-template.php on line
399
Deprecated: Creation of dynamic property WPML_LS_Menu_Item::$current is deprecated in
/home/devwp/public_html/p225-newweb/wp-includes/nav-menu-template.php on line
399
Deprecated: Creation of dynamic property WPML_LS_Menu_Item::$current_item_ancestor is deprecated in
/home/devwp/public_html/p225-newweb/wp-includes/nav-menu-template.php on line
545
Deprecated: Creation of dynamic property WPML_LS_Menu_Item::$current_item_parent is deprecated in
/home/devwp/public_html/p225-newweb/wp-includes/nav-menu-template.php on line
546
Deprecated: Creation of dynamic property ET_Builder_Module_Helper_MultiViewOptions::$inherited_props is deprecated in
/home/devwp/public_html/p225-newweb/wp-content/themes/vsceptre/includes/builder/module/helpers/MultiViewOptions.php on line
686
Deprecated: Creation of dynamic property ET_Builder_Module_Helper_MultiViewOptions::$inherited_props is deprecated in
/home/devwp/public_html/p225-newweb/wp-content/themes/vsceptre/includes/builder/module/helpers/MultiViewOptions.php on line
686
Deprecated: Creation of dynamic property ET_Builder_Module_Helper_MultiViewOptions::$inherited_props is deprecated in
/home/devwp/public_html/p225-newweb/wp-content/themes/vsceptre/includes/builder/module/helpers/MultiViewOptions.php on line
686
Deprecated: Creation of dynamic property ET_Builder_Module_Helper_MultiViewOptions::$inherited_props is deprecated in
/home/devwp/public_html/p225-newweb/wp-content/themes/vsceptre/includes/builder/module/helpers/MultiViewOptions.php on line
686
Deprecated: Creation of dynamic property ET_Builder_Module_Helper_MultiViewOptions::$inherited_props is deprecated in
/home/devwp/public_html/p225-newweb/wp-content/themes/vsceptre/includes/builder/module/helpers/MultiViewOptions.php on line
686
Deprecated: Creation of dynamic property ET_Builder_Module_Helper_MultiViewOptions::$inherited_props is deprecated in
/home/devwp/public_html/p225-newweb/wp-content/themes/vsceptre/includes/builder/module/helpers/MultiViewOptions.php on line
686
Deprecated: Creation of dynamic property ET_Builder_Module_Code::$text_shadow is deprecated in
/home/devwp/public_html/p225-newweb/wp-content/themes/vsceptre/includes/builder/class-et-builder-element.php on line
1315
Deprecated: Creation of dynamic property ET_Builder_Module_Code::$margin_padding is deprecated in
/home/devwp/public_html/p225-newweb/wp-content/themes/vsceptre/includes/builder/class-et-builder-element.php on line
1315
Deprecated: Creation of dynamic property ET_Builder_Module_Code::$_additional_fields_options is deprecated in
/home/devwp/public_html/p225-newweb/wp-content/themes/vsceptre/includes/builder/class-et-builder-element.php on line
1315
Deprecated: Creation of dynamic property ET_Builder_Module_Code::$_original_content is deprecated in
/home/devwp/public_html/p225-newweb/wp-content/themes/vsceptre/includes/builder/class-et-builder-element.php on line
1315
Deprecated: Creation of dynamic property ET_Builder_Module_Helper_MultiViewOptions::$inherited_props is deprecated in
/home/devwp/public_html/p225-newweb/wp-content/themes/vsceptre/includes/builder/module/helpers/MultiViewOptions.php on line
686
Deprecated: Creation of dynamic property ET_Builder_Module_Helper_MultiViewOptions::$inherited_props is deprecated in
/home/devwp/public_html/p225-newweb/wp-content/themes/vsceptre/includes/builder/module/helpers/MultiViewOptions.php on line
686
Deprecated: Creation of dynamic property ET_Builder_Module_Helper_MultiViewOptions::$inherited_props is deprecated in
/home/devwp/public_html/p225-newweb/wp-content/themes/vsceptre/includes/builder/module/helpers/MultiViewOptions.php on line
686
Deprecated: Creation of dynamic property ET_Builder_Module_Helper_MultiViewOptions::$inherited_props is deprecated in
/home/devwp/public_html/p225-newweb/wp-content/themes/vsceptre/includes/builder/module/helpers/MultiViewOptions.php on line
686
Deprecated: Creation of dynamic property ET_Builder_Module_Helper_MultiViewOptions::$inherited_props is deprecated in
/home/devwp/public_html/p225-newweb/wp-content/themes/vsceptre/includes/builder/module/helpers/MultiViewOptions.php on line
686
Deprecated: Creation of dynamic property ET_Builder_Module_PostContent::$text_shadow is deprecated in
/home/devwp/public_html/p225-newweb/wp-content/themes/vsceptre/includes/builder/class-et-builder-element.php on line
1315
Deprecated: Creation of dynamic property ET_Builder_Module_PostContent::$margin_padding is deprecated in
/home/devwp/public_html/p225-newweb/wp-content/themes/vsceptre/includes/builder/class-et-builder-element.php on line
1315
Deprecated: Creation of dynamic property ET_Builder_Module_PostContent::$_additional_fields_options is deprecated in
/home/devwp/public_html/p225-newweb/wp-content/themes/vsceptre/includes/builder/class-et-builder-element.php on line
1315
Deprecated: Creation of dynamic property ET_Builder_Module_PostContent::$_original_content is deprecated in
/home/devwp/public_html/p225-newweb/wp-content/themes/vsceptre/includes/builder/class-et-builder-element.php on line
1315
Deprecated: Creation of dynamic property ET_Builder_Module_Helper_MultiViewOptions::$inherited_props is deprecated in
/home/devwp/public_html/p225-newweb/wp-content/themes/vsceptre/includes/builder/module/helpers/MultiViewOptions.php on line
686
Deprecated: Creation of dynamic property ET_Builder_Module_Helper_MultiViewOptions::$inherited_props is deprecated in
/home/devwp/public_html/p225-newweb/wp-content/themes/vsceptre/includes/builder/module/helpers/MultiViewOptions.php on line
686
Deprecated: Creation of dynamic property ET_Builder_Module_Blog::$text_shadow is deprecated in
/home/devwp/public_html/p225-newweb/wp-content/themes/vsceptre/includes/builder/class-et-builder-element.php on line
1315
Deprecated: Creation of dynamic property ET_Builder_Module_Blog::$margin_padding is deprecated in
/home/devwp/public_html/p225-newweb/wp-content/themes/vsceptre/includes/builder/class-et-builder-element.php on line
1315
Deprecated: Creation of dynamic property ET_Builder_Module_Blog::$_additional_fields_options is deprecated in
/home/devwp/public_html/p225-newweb/wp-content/themes/vsceptre/includes/builder/class-et-builder-element.php on line
1315
Deprecated: Creation of dynamic property ET_Builder_Module_Blog::$_original_content is deprecated in
/home/devwp/public_html/p225-newweb/wp-content/themes/vsceptre/includes/builder/class-et-builder-element.php on line
1315
Deprecated: Creation of dynamic property ET_Builder_Module_Helper_MultiViewOptions::$inherited_props is deprecated in
/home/devwp/public_html/p225-newweb/wp-content/themes/vsceptre/includes/builder/module/helpers/MultiViewOptions.php on line
686
Log Sensitive Data Scrubbing and Scanning on Datadog
Log Sensitive Data Scrubbing and Scanning on Datadog
Deprecated: Creation of dynamic property ET_Builder_Module_Helper_MultiViewOptions::$inherited_props is deprecated in
/home/devwp/public_html/p225-newweb/wp-content/themes/vsceptre/includes/builder/module/helpers/MultiViewOptions.php on line
686
Deprecated: Creation of dynamic property ET_Builder_Module_Helper_MultiViewOptions::$inherited_props is deprecated in
/home/devwp/public_html/p225-newweb/wp-content/themes/vsceptre/includes/builder/module/helpers/MultiViewOptions.php on line
686
Deprecated: Creation of dynamic property ET_Builder_Module_Helper_MultiViewOptions::$inherited_props is deprecated in
/home/devwp/public_html/p225-newweb/wp-content/themes/vsceptre/includes/builder/module/helpers/MultiViewOptions.php on line
686
Deprecated: Creation of dynamic property ET_Builder_Module_Helper_MultiViewOptions::$inherited_props is deprecated in
/home/devwp/public_html/p225-newweb/wp-content/themes/vsceptre/includes/builder/module/helpers/MultiViewOptions.php on line
686
Deprecated: Creation of dynamic property ET_Builder_Module_Helper_MultiViewOptions::$inherited_props is deprecated in
/home/devwp/public_html/p225-newweb/wp-content/themes/vsceptre/includes/builder/module/helpers/MultiViewOptions.php on line
686
Deprecated: Creation of dynamic property ET_Builder_Module_Helper_MultiViewOptions::$inherited_props is deprecated in
/home/devwp/public_html/p225-newweb/wp-content/themes/vsceptre/includes/builder/module/helpers/MultiViewOptions.php on line
686
Deprecated: Creation of dynamic property ET_Builder_Module_Helper_MultiViewOptions::$inherited_props is deprecated in
/home/devwp/public_html/p225-newweb/wp-content/themes/vsceptre/includes/builder/module/helpers/MultiViewOptions.php on line
686
Deprecated: Creation of dynamic property ET_Builder_Module_Helper_MultiViewOptions::$inherited_props is deprecated in
/home/devwp/public_html/p225-newweb/wp-content/themes/vsceptre/includes/builder/module/helpers/MultiViewOptions.php on line
686
Deprecated: Creation of dynamic property ET_Builder_Module_Helper_MultiViewOptions::$inherited_props is deprecated in
/home/devwp/public_html/p225-newweb/wp-content/themes/vsceptre/includes/builder/module/helpers/MultiViewOptions.php on line
686
Deprecated: Creation of dynamic property ET_Builder_Module_Helper_MultiViewOptions::$inherited_props is deprecated in
/home/devwp/public_html/p225-newweb/wp-content/themes/vsceptre/includes/builder/module/helpers/MultiViewOptions.php on line
686
Deprecated: Creation of dynamic property ET_Builder_Module_Helper_MultiViewOptions::$inherited_props is deprecated in
/home/devwp/public_html/p225-newweb/wp-content/themes/vsceptre/includes/builder/module/helpers/MultiViewOptions.php on line
686
Deprecated: Creation of dynamic property ET_Builder_Module_Helper_MultiViewOptions::$inherited_props is deprecated in
/home/devwp/public_html/p225-newweb/wp-content/themes/vsceptre/includes/builder/module/helpers/MultiViewOptions.php on line
686
Deprecated: Creation of dynamic property ET_Builder_Module_Helper_MultiViewOptions::$inherited_props is deprecated in
/home/devwp/public_html/p225-newweb/wp-content/themes/vsceptre/includes/builder/module/helpers/MultiViewOptions.php on line
686
In today’s digital landscape, data security and privacy have become paramount concerns for businesses and individuals alike. With the increasing reliance on cloud-based services and the need to monitor and analyze application logs, it is crucial to ensure that sensitive data remains protected. Datadog offers robust features to help organizations track and analyze their logs effectively. However, it is equally important to understand how to hide sensitive data from logs on Datadog to prevent unauthorized access and potential data breaches. In this blog post, we will explore various techniques and best practices to safeguard sensitive information within your logs while benefiting from the powerful capabilities of Datadog. By implementing these strategies, you can maintain data privacy, comply with regulations, and build customer trust.
Configuring Log Collection to achieve sensitive data scrubbing
As an example, you may hide the IP address from the log entries by adding the following config to the DataDog agent with log collection enabled. We are using a python app and create a file conf.yaml in the conf.d/python.d/ directory with the following content:


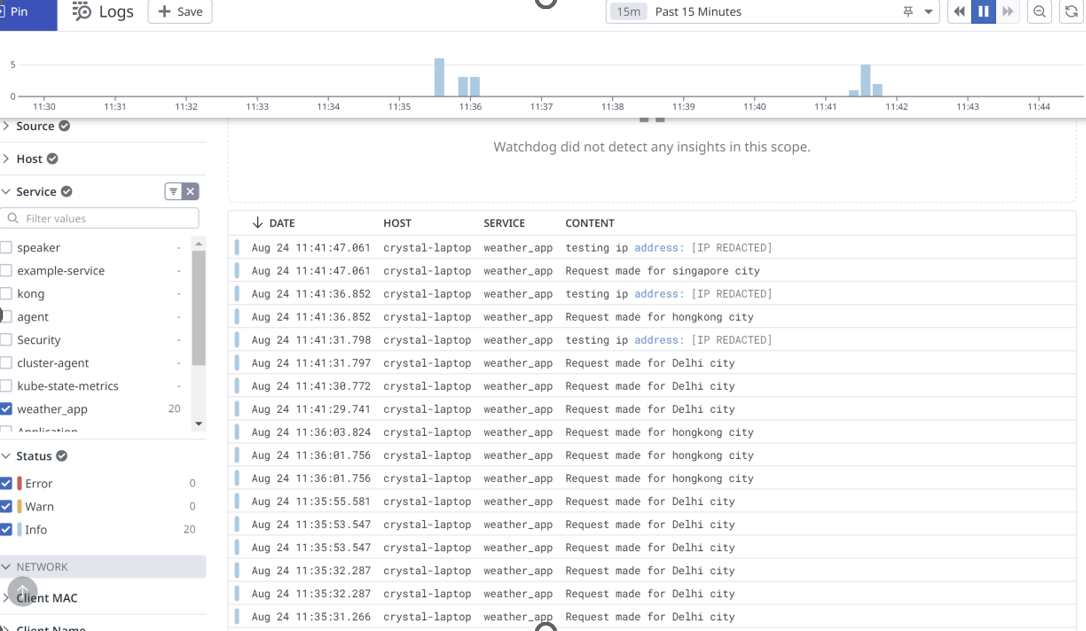
Restart the agent to pick up the new settings, then check the logs collected on DataDog:
You can see that the IP addresses are hidden on the logs collected on Datadog.
Sensitive Data Scanner on Datadog: Protecting Your Logs
Another feature offered by Datadog to help safeguard sensitive data within logs is the Sensitive Data Scanner. This powerful tool allows you to automatically scan your logs for specific patterns or keywords that may indicate the presence of sensitive information such as credit card numbers, social security numbers, or personal identification information.
The Sensitive Data Scanner works by leveraging regular expressions and predefined patterns to identify and flag any potential matches within your log data. By configuring the scanner to search for specific patterns, you can ensure that sensitive data is promptly detected and appropriately handled.
To use a sensitive data scanner
- Go to the Sensitive Data Scanner page and click on Add a scanning group

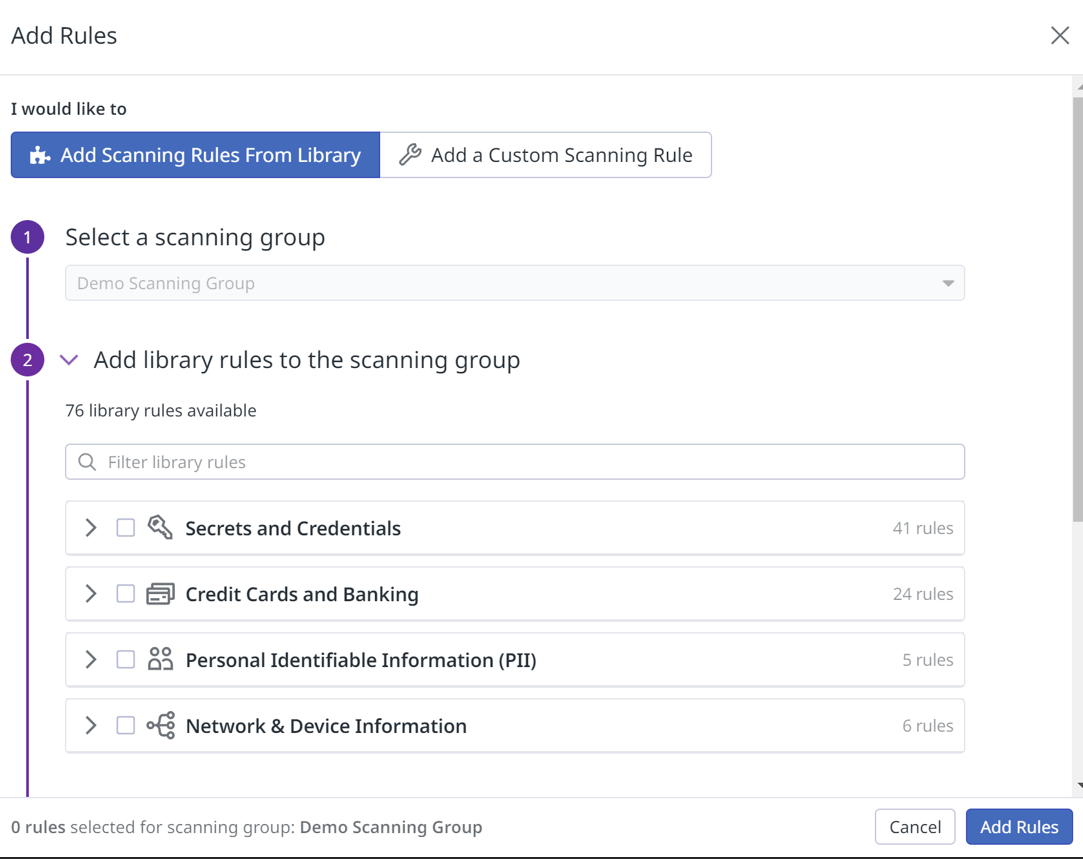
2. Create scanning rule
Scanning rules are used to identify specific sensitive information within the data. In a scanning group, you can either choose from pre-existing scanning rules in Datadog’s Scanning Rule Library or create your own rules using custom regex patterns for scanning.
Scanning rules are used to identify specific sensitive information within the data. In a scanning group, you can either choose from pre-existing scanning rules in Datadog’s Scanning Rule Library or create your own rules using custom regex patterns for scanning.
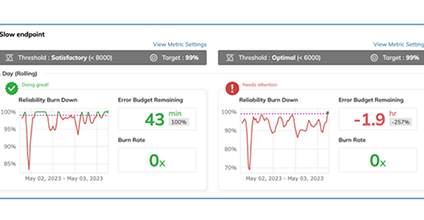
View out-of-the-box Sensitive Data Scanner Overview Dashboard:
In conclusion, implementing log-sensitive data scrubbing and scanning on Datadog is a crucial step toward ensuring data privacy and security. By defining scanning rules and utilizing custom regex patterns, you can effectively identify and protect sensitive information within your logs. With the flexibility and power of Datadog’s Scanning Rule Library, you have the tools necessary to safeguard your data and maintain compliance with privacy regulations. Start implementing these practices today to enhance your data protection strategy and gain peace of mind.
Further Readings
https://docs.datadoghq.com/agent/logs/advanced_log_collection/?tab=configurationfile#scrub-sensitive-data-from-your-logs
https://www.datadoghq.com/product/sensitive-data-scanner/


