Deprecated: Using ${var} in strings is deprecated, use {$var} instead in
/home/devwp/public_html/p225-newweb/wp-content/themes/vsceptre/includes/builder/module/settings/migration/ColumnOptions.php on line
95
Deprecated: Using ${var} in strings is deprecated, use {$var} instead in
/home/devwp/public_html/p225-newweb/wp-content/themes/vsceptre/includes/builder/module/settings/migration/ColumnOptions.php on line
95
Deprecated: Using ${var} in strings is deprecated, use {$var} instead in
/home/devwp/public_html/p225-newweb/wp-content/themes/vsceptre/includes/builder/module/settings/migration/ColumnOptions.php on line
97
Deprecated: Using ${var} in strings is deprecated, use {$var} instead in
/home/devwp/public_html/p225-newweb/wp-content/themes/vsceptre/includes/builder/module/settings/migration/ColumnOptions.php on line
97
Deprecated: Using ${var} in strings is deprecated, use {$var} instead in
/home/devwp/public_html/p225-newweb/wp-content/themes/vsceptre/includes/builder/module/settings/migration/ColumnOptions.php on line
103
Deprecated: Using ${var} in strings is deprecated, use {$var} instead in
/home/devwp/public_html/p225-newweb/wp-content/themes/vsceptre/includes/builder/module/settings/migration/ColumnOptions.php on line
103
Deprecated: Using ${var} in strings is deprecated, use {$var} instead in
/home/devwp/public_html/p225-newweb/wp-content/themes/vsceptre/includes/builder/module/settings/migration/ColumnOptions.php on line
105
Deprecated: Using ${var} in strings is deprecated, use {$var} instead in
/home/devwp/public_html/p225-newweb/wp-content/themes/vsceptre/includes/builder/module/settings/migration/ColumnOptions.php on line
105
Deprecated: Using ${var} in strings is deprecated, use {$var} instead in
/home/devwp/public_html/p225-newweb/wp-content/themes/vsceptre/includes/builder/module/settings/migration/ColumnOptions.php on line
130
Deprecated: Using ${var} in strings is deprecated, use {$var} instead in
/home/devwp/public_html/p225-newweb/wp-content/themes/vsceptre/includes/builder/module/settings/migration/ColumnOptions.php on line
130
Deprecated: Using ${var} in strings is deprecated, use {$var} instead in
/home/devwp/public_html/p225-newweb/wp-content/themes/vsceptre/includes/builder/module/settings/migration/ColumnOptions.php on line
132
Deprecated: Using ${var} in strings is deprecated, use {$var} instead in
/home/devwp/public_html/p225-newweb/wp-content/themes/vsceptre/includes/builder/module/settings/migration/ColumnOptions.php on line
132
Deprecated: Using ${var} in strings is deprecated, use {$var} instead in
/home/devwp/public_html/p225-newweb/wp-content/themes/vsceptre/includes/builder/module/settings/migration/ColumnOptions.php on line
161
Deprecated: Using ${var} in strings is deprecated, use {$var} instead in
/home/devwp/public_html/p225-newweb/wp-content/themes/vsceptre/includes/builder/module/settings/migration/ColumnOptions.php on line
161
Deprecated: Using ${var} in strings is deprecated, use {$var} instead in
/home/devwp/public_html/p225-newweb/wp-content/themes/vsceptre/includes/builder/module/settings/migration/ColumnOptions.php on line
161
Deprecated: Using ${var} in strings is deprecated, use {$var} instead in
/home/devwp/public_html/p225-newweb/wp-content/themes/vsceptre/includes/builder/module/settings/migration/ColumnOptions.php on line
162
Deprecated: Using ${var} in strings is deprecated, use {$var} instead in
/home/devwp/public_html/p225-newweb/wp-content/themes/vsceptre/includes/builder/module/settings/migration/ColumnOptions.php on line
162
Deprecated: Using ${var} in strings is deprecated, use {$var} instead in
/home/devwp/public_html/p225-newweb/wp-content/themes/vsceptre/includes/builder/module/settings/migration/ColumnOptions.php on line
162
Deprecated: Using ${var} in strings is deprecated, use {$var} instead in
/home/devwp/public_html/p225-newweb/wp-content/themes/vsceptre/includes/builder/module/settings/migration/ColumnOptions.php on line
205
Deprecated: Using ${var} in strings is deprecated, use {$var} instead in
/home/devwp/public_html/p225-newweb/wp-content/themes/vsceptre/includes/builder/module/settings/migration/ColumnOptions.php on line
205
Deprecated: Using ${var} in strings is deprecated, use {$var} instead in
/home/devwp/public_html/p225-newweb/wp-content/themes/vsceptre/includes/builder/module/settings/migration/ColumnOptions.php on line
205
Deprecated: Using ${var} in strings is deprecated, use {$var} instead in
/home/devwp/public_html/p225-newweb/wp-content/themes/vsceptre/includes/builder/module/settings/migration/ColumnOptions.php on line
205
Deprecated: Using ${var} in strings is deprecated, use {$var} instead in
/home/devwp/public_html/p225-newweb/wp-content/themes/vsceptre/includes/builder/module/settings/migration/ColumnOptions.php on line
207
Deprecated: Using ${var} in strings is deprecated, use {$var} instead in
/home/devwp/public_html/p225-newweb/wp-content/themes/vsceptre/includes/builder/module/settings/migration/ColumnOptions.php on line
207
Deprecated: Using ${var} in strings is deprecated, use {$var} instead in
/home/devwp/public_html/p225-newweb/wp-content/themes/vsceptre/includes/builder/module/settings/migration/ColumnOptions.php on line
207
Deprecated: Creation of dynamic property ET_Builder_Section::$_original_content is deprecated in
/home/devwp/public_html/p225-newweb/wp-content/themes/vsceptre/includes/builder/class-et-builder-element.php on line
1315
Deprecated: Creation of dynamic property ET_Builder_Module_Helper_MultiViewOptions::$inherited_props is deprecated in
/home/devwp/public_html/p225-newweb/wp-content/themes/vsceptre/includes/builder/module/helpers/MultiViewOptions.php on line
686
Deprecated: Creation of dynamic property ET_Builder_Module_Field_Divider::$count is deprecated in
/home/devwp/public_html/p225-newweb/wp-content/themes/vsceptre/includes/builder/main-structure-elements.php on line
1498
Deprecated: Creation of dynamic property ET_Builder_Row::$_original_content is deprecated in
/home/devwp/public_html/p225-newweb/wp-content/themes/vsceptre/includes/builder/class-et-builder-element.php on line
1315
Deprecated: Creation of dynamic property ET_Builder_Column::$_original_content is deprecated in
/home/devwp/public_html/p225-newweb/wp-content/themes/vsceptre/includes/builder/class-et-builder-element.php on line
1315
Deprecated: Creation of dynamic property ET_Builder_Module_Text::$text_shadow is deprecated in
/home/devwp/public_html/p225-newweb/wp-content/themes/vsceptre/includes/builder/class-et-builder-element.php on line
1315
Deprecated: Creation of dynamic property ET_Builder_Module_Text::$margin_padding is deprecated in
/home/devwp/public_html/p225-newweb/wp-content/themes/vsceptre/includes/builder/class-et-builder-element.php on line
1315
Deprecated: Creation of dynamic property ET_Builder_Module_Text::$_additional_fields_options is deprecated in
/home/devwp/public_html/p225-newweb/wp-content/themes/vsceptre/includes/builder/class-et-builder-element.php on line
1315
Deprecated: Creation of dynamic property ET_Builder_Module_Text::$_original_content is deprecated in
/home/devwp/public_html/p225-newweb/wp-content/themes/vsceptre/includes/builder/class-et-builder-element.php on line
1315
Deprecated: Creation of dynamic property ET_Builder_Module_Helper_MultiViewOptions::$inherited_props is deprecated in
/home/devwp/public_html/p225-newweb/wp-content/themes/vsceptre/includes/builder/module/helpers/MultiViewOptions.php on line
686
Deprecated: Creation of dynamic property ET_Builder_Module_Menu::$text_shadow is deprecated in
/home/devwp/public_html/p225-newweb/wp-content/themes/vsceptre/includes/builder/class-et-builder-element.php on line
1315
Deprecated: Creation of dynamic property ET_Builder_Module_Menu::$margin_padding is deprecated in
/home/devwp/public_html/p225-newweb/wp-content/themes/vsceptre/includes/builder/class-et-builder-element.php on line
1315
Deprecated: Creation of dynamic property ET_Builder_Module_Menu::$_additional_fields_options is deprecated in
/home/devwp/public_html/p225-newweb/wp-content/themes/vsceptre/includes/builder/class-et-builder-element.php on line
1315
Deprecated: Creation of dynamic property ET_Builder_Module_Menu::$_original_content is deprecated in
/home/devwp/public_html/p225-newweb/wp-content/themes/vsceptre/includes/builder/class-et-builder-element.php on line
1315
Deprecated: Creation of dynamic property WPML_LS_Menu_Item::$current is deprecated in
/home/devwp/public_html/p225-newweb/wp-includes/nav-menu-template.php on line
399
Deprecated: Creation of dynamic property WPML_LS_Menu_Item::$current is deprecated in
/home/devwp/public_html/p225-newweb/wp-includes/nav-menu-template.php on line
399
Deprecated: Creation of dynamic property WPML_LS_Menu_Item::$current is deprecated in
/home/devwp/public_html/p225-newweb/wp-includes/nav-menu-template.php on line
399
Deprecated: Creation of dynamic property WPML_LS_Menu_Item::$current_item_ancestor is deprecated in
/home/devwp/public_html/p225-newweb/wp-includes/nav-menu-template.php on line
545
Deprecated: Creation of dynamic property WPML_LS_Menu_Item::$current_item_parent is deprecated in
/home/devwp/public_html/p225-newweb/wp-includes/nav-menu-template.php on line
546
Deprecated: Creation of dynamic property ET_Builder_Module_Helper_MultiViewOptions::$inherited_props is deprecated in
/home/devwp/public_html/p225-newweb/wp-content/themes/vsceptre/includes/builder/module/helpers/MultiViewOptions.php on line
686
Deprecated: Creation of dynamic property ET_Builder_Module_Helper_MultiViewOptions::$inherited_props is deprecated in
/home/devwp/public_html/p225-newweb/wp-content/themes/vsceptre/includes/builder/module/helpers/MultiViewOptions.php on line
686
Deprecated: Creation of dynamic property ET_Builder_Module_Helper_MultiViewOptions::$inherited_props is deprecated in
/home/devwp/public_html/p225-newweb/wp-content/themes/vsceptre/includes/builder/module/helpers/MultiViewOptions.php on line
686
Deprecated: Creation of dynamic property ET_Builder_Module_Search::$text_shadow is deprecated in
/home/devwp/public_html/p225-newweb/wp-content/themes/vsceptre/includes/builder/class-et-builder-element.php on line
1315
Deprecated: Creation of dynamic property ET_Builder_Module_Search::$margin_padding is deprecated in
/home/devwp/public_html/p225-newweb/wp-content/themes/vsceptre/includes/builder/class-et-builder-element.php on line
1315
Deprecated: Creation of dynamic property ET_Builder_Module_Search::$_additional_fields_options is deprecated in
/home/devwp/public_html/p225-newweb/wp-content/themes/vsceptre/includes/builder/class-et-builder-element.php on line
1315
Deprecated: Creation of dynamic property ET_Builder_Module_Image::$text_shadow is deprecated in
/home/devwp/public_html/p225-newweb/wp-content/themes/vsceptre/includes/builder/class-et-builder-element.php on line
1315
Deprecated: Creation of dynamic property ET_Builder_Module_Image::$margin_padding is deprecated in
/home/devwp/public_html/p225-newweb/wp-content/themes/vsceptre/includes/builder/class-et-builder-element.php on line
1315
Deprecated: Creation of dynamic property ET_Builder_Module_Image::$_additional_fields_options is deprecated in
/home/devwp/public_html/p225-newweb/wp-content/themes/vsceptre/includes/builder/class-et-builder-element.php on line
1315
Deprecated: Creation of dynamic property ET_Builder_Module_Image::$_original_content is deprecated in
/home/devwp/public_html/p225-newweb/wp-content/themes/vsceptre/includes/builder/class-et-builder-element.php on line
1315
Deprecated: Creation of dynamic property ET_Builder_Module_Helper_MultiViewOptions::$inherited_props is deprecated in
/home/devwp/public_html/p225-newweb/wp-content/themes/vsceptre/includes/builder/module/helpers/MultiViewOptions.php on line
686
Deprecated: Creation of dynamic property ET_Builder_Module_Helper_MultiViewOptions::$inherited_props is deprecated in
/home/devwp/public_html/p225-newweb/wp-content/themes/vsceptre/includes/builder/module/helpers/MultiViewOptions.php on line
686
Deprecated: Creation of dynamic property ET_Builder_Module_Helper_MultiViewOptions::$inherited_props is deprecated in
/home/devwp/public_html/p225-newweb/wp-content/themes/vsceptre/includes/builder/module/helpers/MultiViewOptions.php on line
686
Deprecated: Creation of dynamic property ET_Builder_Module_Helper_MultiViewOptions::$inherited_props is deprecated in
/home/devwp/public_html/p225-newweb/wp-content/themes/vsceptre/includes/builder/module/helpers/MultiViewOptions.php on line
686
Deprecated: Creation of dynamic property ET_Builder_Module_Helper_MultiViewOptions::$inherited_props is deprecated in
/home/devwp/public_html/p225-newweb/wp-content/themes/vsceptre/includes/builder/module/helpers/MultiViewOptions.php on line
686
Deprecated: Creation of dynamic property ET_Builder_Module_Search::$_original_content is deprecated in
/home/devwp/public_html/p225-newweb/wp-content/themes/vsceptre/includes/builder/class-et-builder-element.php on line
1315
Deprecated: Creation of dynamic property ET_Builder_Module_Helper_MultiViewOptions::$inherited_props is deprecated in
/home/devwp/public_html/p225-newweb/wp-content/themes/vsceptre/includes/builder/module/helpers/MultiViewOptions.php on line
686
Deprecated: Creation of dynamic property ET_Builder_Module_Helper_MultiViewOptions::$inherited_props is deprecated in
/home/devwp/public_html/p225-newweb/wp-content/themes/vsceptre/includes/builder/module/helpers/MultiViewOptions.php on line
686
Deprecated: Creation of dynamic property ET_Builder_Module_Helper_MultiViewOptions::$inherited_props is deprecated in
/home/devwp/public_html/p225-newweb/wp-content/themes/vsceptre/includes/builder/module/helpers/MultiViewOptions.php on line
686
Deprecated: Creation of dynamic property ET_Builder_Module_Helper_MultiViewOptions::$inherited_props is deprecated in
/home/devwp/public_html/p225-newweb/wp-content/themes/vsceptre/includes/builder/module/helpers/MultiViewOptions.php on line
686
Deprecated: Creation of dynamic property ET_Builder_Module_Helper_MultiViewOptions::$inherited_props is deprecated in
/home/devwp/public_html/p225-newweb/wp-content/themes/vsceptre/includes/builder/module/helpers/MultiViewOptions.php on line
686
Deprecated: Creation of dynamic property ET_Builder_Module_Helper_MultiViewOptions::$inherited_props is deprecated in
/home/devwp/public_html/p225-newweb/wp-content/themes/vsceptre/includes/builder/module/helpers/MultiViewOptions.php on line
686
Deprecated: Creation of dynamic property WPML_LS_Menu_Item::$current is deprecated in
/home/devwp/public_html/p225-newweb/wp-includes/nav-menu-template.php on line
399
Deprecated: Creation of dynamic property WPML_LS_Menu_Item::$current is deprecated in
/home/devwp/public_html/p225-newweb/wp-includes/nav-menu-template.php on line
399
Deprecated: Creation of dynamic property WPML_LS_Menu_Item::$current is deprecated in
/home/devwp/public_html/p225-newweb/wp-includes/nav-menu-template.php on line
399
Deprecated: Creation of dynamic property WPML_LS_Menu_Item::$current_item_ancestor is deprecated in
/home/devwp/public_html/p225-newweb/wp-includes/nav-menu-template.php on line
545
Deprecated: Creation of dynamic property WPML_LS_Menu_Item::$current_item_parent is deprecated in
/home/devwp/public_html/p225-newweb/wp-includes/nav-menu-template.php on line
546
Deprecated: Creation of dynamic property ET_Builder_Module_Helper_MultiViewOptions::$inherited_props is deprecated in
/home/devwp/public_html/p225-newweb/wp-content/themes/vsceptre/includes/builder/module/helpers/MultiViewOptions.php on line
686
Deprecated: Creation of dynamic property ET_Builder_Module_Helper_MultiViewOptions::$inherited_props is deprecated in
/home/devwp/public_html/p225-newweb/wp-content/themes/vsceptre/includes/builder/module/helpers/MultiViewOptions.php on line
686
Deprecated: Creation of dynamic property ET_Builder_Module_Helper_MultiViewOptions::$inherited_props is deprecated in
/home/devwp/public_html/p225-newweb/wp-content/themes/vsceptre/includes/builder/module/helpers/MultiViewOptions.php on line
686
Deprecated: Creation of dynamic property ET_Builder_Module_Helper_MultiViewOptions::$inherited_props is deprecated in
/home/devwp/public_html/p225-newweb/wp-content/themes/vsceptre/includes/builder/module/helpers/MultiViewOptions.php on line
686
Deprecated: Creation of dynamic property ET_Builder_Module_Helper_MultiViewOptions::$inherited_props is deprecated in
/home/devwp/public_html/p225-newweb/wp-content/themes/vsceptre/includes/builder/module/helpers/MultiViewOptions.php on line
686
Deprecated: Creation of dynamic property ET_Builder_Module_Helper_MultiViewOptions::$inherited_props is deprecated in
/home/devwp/public_html/p225-newweb/wp-content/themes/vsceptre/includes/builder/module/helpers/MultiViewOptions.php on line
686
Deprecated: Creation of dynamic property ET_Builder_Module_Code::$text_shadow is deprecated in
/home/devwp/public_html/p225-newweb/wp-content/themes/vsceptre/includes/builder/class-et-builder-element.php on line
1315
Deprecated: Creation of dynamic property ET_Builder_Module_Code::$margin_padding is deprecated in
/home/devwp/public_html/p225-newweb/wp-content/themes/vsceptre/includes/builder/class-et-builder-element.php on line
1315
Deprecated: Creation of dynamic property ET_Builder_Module_Code::$_additional_fields_options is deprecated in
/home/devwp/public_html/p225-newweb/wp-content/themes/vsceptre/includes/builder/class-et-builder-element.php on line
1315
Deprecated: Creation of dynamic property ET_Builder_Module_Code::$_original_content is deprecated in
/home/devwp/public_html/p225-newweb/wp-content/themes/vsceptre/includes/builder/class-et-builder-element.php on line
1315
Deprecated: Creation of dynamic property ET_Builder_Module_Helper_MultiViewOptions::$inherited_props is deprecated in
/home/devwp/public_html/p225-newweb/wp-content/themes/vsceptre/includes/builder/module/helpers/MultiViewOptions.php on line
686
Deprecated: Creation of dynamic property ET_Builder_Module_Helper_MultiViewOptions::$inherited_props is deprecated in
/home/devwp/public_html/p225-newweb/wp-content/themes/vsceptre/includes/builder/module/helpers/MultiViewOptions.php on line
686
Deprecated: Creation of dynamic property ET_Builder_Module_Helper_MultiViewOptions::$inherited_props is deprecated in
/home/devwp/public_html/p225-newweb/wp-content/themes/vsceptre/includes/builder/module/helpers/MultiViewOptions.php on line
686
Deprecated: Creation of dynamic property ET_Builder_Module_Helper_MultiViewOptions::$inherited_props is deprecated in
/home/devwp/public_html/p225-newweb/wp-content/themes/vsceptre/includes/builder/module/helpers/MultiViewOptions.php on line
686
Deprecated: Creation of dynamic property ET_Builder_Module_Helper_MultiViewOptions::$inherited_props is deprecated in
/home/devwp/public_html/p225-newweb/wp-content/themes/vsceptre/includes/builder/module/helpers/MultiViewOptions.php on line
686
Deprecated: Creation of dynamic property ET_Builder_Module_PostContent::$text_shadow is deprecated in
/home/devwp/public_html/p225-newweb/wp-content/themes/vsceptre/includes/builder/class-et-builder-element.php on line
1315
Deprecated: Creation of dynamic property ET_Builder_Module_PostContent::$margin_padding is deprecated in
/home/devwp/public_html/p225-newweb/wp-content/themes/vsceptre/includes/builder/class-et-builder-element.php on line
1315
Deprecated: Creation of dynamic property ET_Builder_Module_PostContent::$_additional_fields_options is deprecated in
/home/devwp/public_html/p225-newweb/wp-content/themes/vsceptre/includes/builder/class-et-builder-element.php on line
1315
Deprecated: Creation of dynamic property ET_Builder_Module_PostContent::$_original_content is deprecated in
/home/devwp/public_html/p225-newweb/wp-content/themes/vsceptre/includes/builder/class-et-builder-element.php on line
1315
Deprecated: Creation of dynamic property ET_Builder_Module_Helper_MultiViewOptions::$inherited_props is deprecated in
/home/devwp/public_html/p225-newweb/wp-content/themes/vsceptre/includes/builder/module/helpers/MultiViewOptions.php on line
686
Deprecated: Creation of dynamic property ET_Builder_Module_Helper_MultiViewOptions::$inherited_props is deprecated in
/home/devwp/public_html/p225-newweb/wp-content/themes/vsceptre/includes/builder/module/helpers/MultiViewOptions.php on line
686
Deprecated: Creation of dynamic property ET_Builder_Module_Blog::$text_shadow is deprecated in
/home/devwp/public_html/p225-newweb/wp-content/themes/vsceptre/includes/builder/class-et-builder-element.php on line
1315
Deprecated: Creation of dynamic property ET_Builder_Module_Blog::$margin_padding is deprecated in
/home/devwp/public_html/p225-newweb/wp-content/themes/vsceptre/includes/builder/class-et-builder-element.php on line
1315
Deprecated: Creation of dynamic property ET_Builder_Module_Blog::$_additional_fields_options is deprecated in
/home/devwp/public_html/p225-newweb/wp-content/themes/vsceptre/includes/builder/class-et-builder-element.php on line
1315
Deprecated: Creation of dynamic property ET_Builder_Module_Blog::$_original_content is deprecated in
/home/devwp/public_html/p225-newweb/wp-content/themes/vsceptre/includes/builder/class-et-builder-element.php on line
1315
Deprecated: Creation of dynamic property ET_Builder_Module_Helper_MultiViewOptions::$inherited_props is deprecated in
/home/devwp/public_html/p225-newweb/wp-content/themes/vsceptre/includes/builder/module/helpers/MultiViewOptions.php on line
686
Monitoring temperature of my DietPi Homelab cluster with Grafana Cloud
Monitoring temperature of my DietPi Homelab cluster with Grafana Cloud
Deprecated: Creation of dynamic property ET_Builder_Module_Helper_MultiViewOptions::$inherited_props is deprecated in
/home/devwp/public_html/p225-newweb/wp-content/themes/vsceptre/includes/builder/module/helpers/MultiViewOptions.php on line
686
Deprecated: Creation of dynamic property ET_Builder_Module_Helper_MultiViewOptions::$inherited_props is deprecated in
/home/devwp/public_html/p225-newweb/wp-content/themes/vsceptre/includes/builder/module/helpers/MultiViewOptions.php on line
686
Deprecated: Creation of dynamic property ET_Builder_Module_Helper_MultiViewOptions::$inherited_props is deprecated in
/home/devwp/public_html/p225-newweb/wp-content/themes/vsceptre/includes/builder/module/helpers/MultiViewOptions.php on line
686
Deprecated: Creation of dynamic property ET_Builder_Module_Helper_MultiViewOptions::$inherited_props is deprecated in
/home/devwp/public_html/p225-newweb/wp-content/themes/vsceptre/includes/builder/module/helpers/MultiViewOptions.php on line
686
Deprecated: Creation of dynamic property ET_Builder_Module_Helper_MultiViewOptions::$inherited_props is deprecated in
/home/devwp/public_html/p225-newweb/wp-content/themes/vsceptre/includes/builder/module/helpers/MultiViewOptions.php on line
686
Deprecated: Creation of dynamic property ET_Builder_Module_Helper_MultiViewOptions::$inherited_props is deprecated in
/home/devwp/public_html/p225-newweb/wp-content/themes/vsceptre/includes/builder/module/helpers/MultiViewOptions.php on line
686
Deprecated: Creation of dynamic property ET_Builder_Module_Helper_MultiViewOptions::$inherited_props is deprecated in
/home/devwp/public_html/p225-newweb/wp-content/themes/vsceptre/includes/builder/module/helpers/MultiViewOptions.php on line
686
Deprecated: Creation of dynamic property ET_Builder_Module_Helper_MultiViewOptions::$inherited_props is deprecated in
/home/devwp/public_html/p225-newweb/wp-content/themes/vsceptre/includes/builder/module/helpers/MultiViewOptions.php on line
686
Deprecated: Creation of dynamic property ET_Builder_Module_Helper_MultiViewOptions::$inherited_props is deprecated in
/home/devwp/public_html/p225-newweb/wp-content/themes/vsceptre/includes/builder/module/helpers/MultiViewOptions.php on line
686
Deprecated: Creation of dynamic property ET_Builder_Module_Helper_MultiViewOptions::$inherited_props is deprecated in
/home/devwp/public_html/p225-newweb/wp-content/themes/vsceptre/includes/builder/module/helpers/MultiViewOptions.php on line
686
Deprecated: Creation of dynamic property ET_Builder_Module_Helper_MultiViewOptions::$inherited_props is deprecated in
/home/devwp/public_html/p225-newweb/wp-content/themes/vsceptre/includes/builder/module/helpers/MultiViewOptions.php on line
686
Deprecated: Creation of dynamic property ET_Builder_Module_Helper_MultiViewOptions::$inherited_props is deprecated in
/home/devwp/public_html/p225-newweb/wp-content/themes/vsceptre/includes/builder/module/helpers/MultiViewOptions.php on line
686
Deprecated: Creation of dynamic property ET_Builder_Module_Helper_MultiViewOptions::$inherited_props is deprecated in
/home/devwp/public_html/p225-newweb/wp-content/themes/vsceptre/includes/builder/module/helpers/MultiViewOptions.php on line
686
Deprecated: Creation of dynamic property ET_Builder_Module_Helper_MultiViewOptions::$inherited_props is deprecated in
/home/devwp/public_html/p225-newweb/wp-content/themes/vsceptre/includes/builder/module/helpers/MultiViewOptions.php on line
686
Deprecated: Creation of dynamic property ET_Builder_Module_Helper_MultiViewOptions::$inherited_props is deprecated in
/home/devwp/public_html/p225-newweb/wp-content/themes/vsceptre/includes/builder/module/helpers/MultiViewOptions.php on line
686
Deprecated: Creation of dynamic property ET_Builder_Module_Helper_MultiViewOptions::$inherited_props is deprecated in
/home/devwp/public_html/p225-newweb/wp-content/themes/vsceptre/includes/builder/module/helpers/MultiViewOptions.php on line
686
Deprecated: Creation of dynamic property ET_Builder_Module_Helper_MultiViewOptions::$inherited_props is deprecated in
/home/devwp/public_html/p225-newweb/wp-content/themes/vsceptre/includes/builder/module/helpers/MultiViewOptions.php on line
686
Deprecated: Creation of dynamic property ET_Builder_Module_Helper_MultiViewOptions::$inherited_props is deprecated in
/home/devwp/public_html/p225-newweb/wp-content/themes/vsceptre/includes/builder/module/helpers/MultiViewOptions.php on line
686
Deprecated: Creation of dynamic property ET_Builder_Module_Helper_MultiViewOptions::$inherited_props is deprecated in
/home/devwp/public_html/p225-newweb/wp-content/themes/vsceptre/includes/builder/module/helpers/MultiViewOptions.php on line
686
Deprecated: Creation of dynamic property ET_Builder_Module_Helper_MultiViewOptions::$inherited_props is deprecated in
/home/devwp/public_html/p225-newweb/wp-content/themes/vsceptre/includes/builder/module/helpers/MultiViewOptions.php on line
686
Deprecated: Creation of dynamic property ET_Builder_Module_Helper_MultiViewOptions::$inherited_props is deprecated in
/home/devwp/public_html/p225-newweb/wp-content/themes/vsceptre/includes/builder/module/helpers/MultiViewOptions.php on line
686
Deprecated: Creation of dynamic property ET_Builder_Module_Team_Member::$text_shadow is deprecated in
/home/devwp/public_html/p225-newweb/wp-content/themes/vsceptre/includes/builder/class-et-builder-element.php on line
1315
Deprecated: Creation of dynamic property ET_Builder_Module_Team_Member::$margin_padding is deprecated in
/home/devwp/public_html/p225-newweb/wp-content/themes/vsceptre/includes/builder/class-et-builder-element.php on line
1315
Deprecated: Creation of dynamic property ET_Builder_Module_Team_Member::$_additional_fields_options is deprecated in
/home/devwp/public_html/p225-newweb/wp-content/themes/vsceptre/includes/builder/class-et-builder-element.php on line
1315
Deprecated: Creation of dynamic property ET_Builder_Module_Team_Member::$_original_content is deprecated in
/home/devwp/public_html/p225-newweb/wp-content/themes/vsceptre/includes/builder/class-et-builder-element.php on line
1315
Deprecated: Creation of dynamic property ET_Builder_Module_Helper_MultiViewOptions::$inherited_props is deprecated in
/home/devwp/public_html/p225-newweb/wp-content/themes/vsceptre/includes/builder/module/helpers/MultiViewOptions.php on line
686
Problem Statement
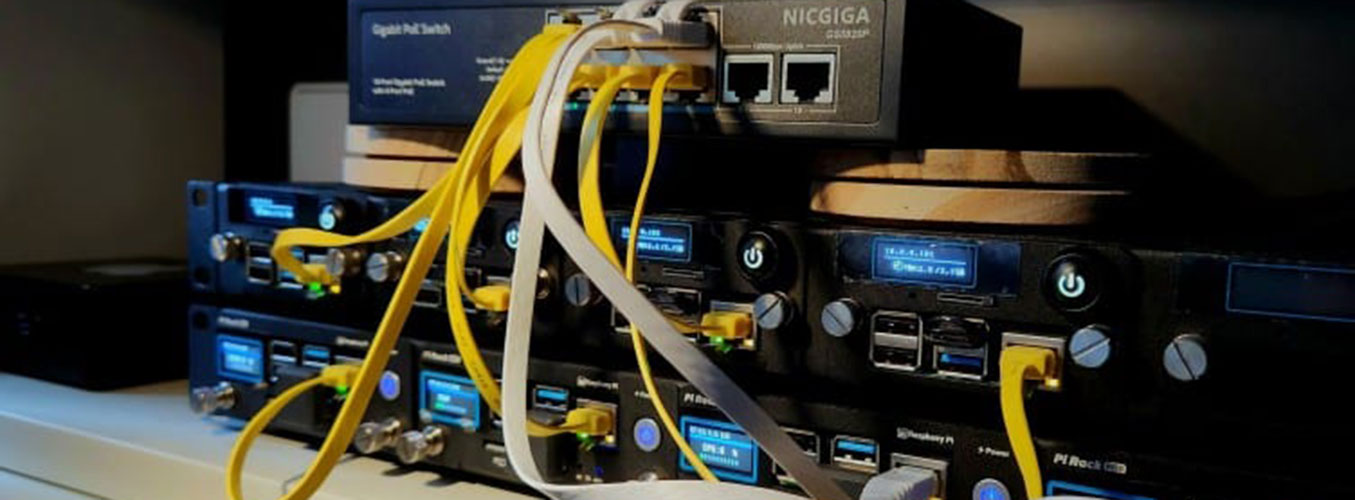
At around end of March, I want to get my hands on the old raspberry pi cluster again as I need a testbed for K8S, ChatOps, CI/CD etc. The DevOps ecosystem in 2023 is more ARM ready compared with 2020 which makes building a usable K8S stack on Pi realistic. I upgraded from a 4 nodes cluster to a 7 Pi4 nodes with POE capabilities, SSD, USB and sitting inside a nice 1U rack. Then spending the next two months’ time on testing various OS. Re-installing the whole stack multiple times and struggling with the home router is fun. At the end the cluster is up with all platform engineering tools deployed.

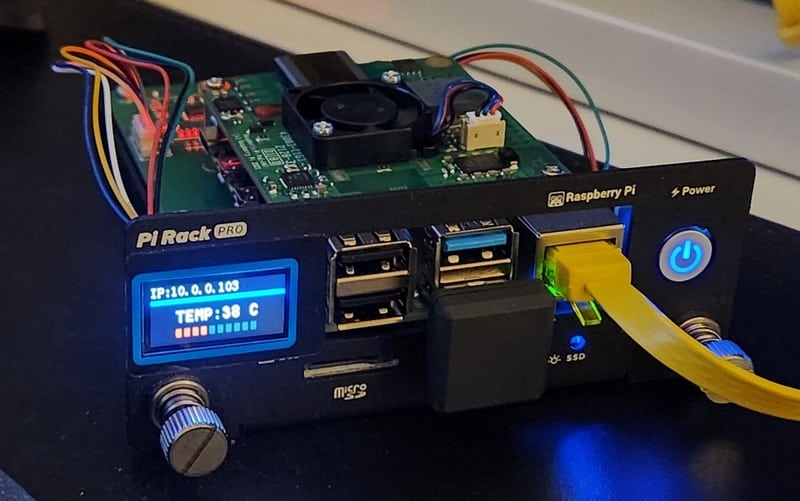
From the software perspective it all works fine. However, I quickly realize that the ventilation inside the rack is not good as what I expected. Although each Pi POE head comes with a fan and heatsink added the CPU temperature can easily goes above 60 degrees after an hour or so. Although the Pi rack comes with some nice LED displays with information on the temp of the Pi but that’s a bit small to look at. I need to find a solution to monitor the temperature of the whole stack easily. Ideally the monitoring can be presented on a nice dashboard with alerting capabilities. I decided to work on a solution to address the problem but keep coding to a minimum.
Solution
I want to share how I derived a solution for this without getting into too much (but unavoidable) technical detail. The goal is to build something fast and easily accessible. At the same time avoid toil in deployment.
Step 1: Writing shell script to temperature as metrics in Prometheus scrap-able format.
#!/bin/s
while true; do
ncat -l -p 7027 --sh-exec '\
C="rpitemp $(cat /sys/class/thermal/thermal_zone0/temp | sed "s/\([0-9]\{2\}\)/\1./")"; \
printf "HTTP/1.0 200 OK\nContent-Length: ${#C}\n\n$C"'
done
I am using dietpi OS and this few lines of code can provide me a simple line of “rpitemp 39.5” from port 7027. Ready for scraping by Prometheus.
Step 2: Use ansible to deploy the script to all nodes.
I turned the above into a script, use ansible to copy the file to all nodes and set the script to run at boot. Below is the ansible playbook.yml.
- name: Set cron job for getting temperature from all worker node
hosts: workers
tasks:
- name: Copy temp.sh file to all worker nodes
become: true
copy:
src: /home/dietpi/temp.sh
dest: /home/dietpi/temp.sh
owner: root
group: root
mode: 0700
- name: Create an entry in crontab for getting the pi temp on every restart
ansible.builtin.cron:
name: "a job for reboot"
special_time: reboot
job: "/home/dietpi/temp.sh &"
Step 3: Start a prometheus docker on the control node and scrap temperature metrics from all worker nodes.
Below is the prometheus.yml file. Using remote_write to send metrics from all worker nodes to Grafana Cloud.
global:
scrape_interval: 15s
evaluation_interval: 15s
scrape_configs:
- job_name: "piet_temp_control01"
metrics_path: '/'
static_configs:
- targets: ["10.0.0.100:7027"]
- targets: ['10.0.0.101:7027']
- targets: ['10.0.0.102:7027']
- targets: ['10.0.0.103:7027']
- targets: ['10.0.0.104:7027']
- targets: ['10.0.0.105:7027']
- targets: ['10.0.0.106:7027']
# remote write location
remote_write:
- url: [granfana cloud URL]
basic_auth:
username: [username]
password: [password]
Step 4: Sign up a Grafana cloud free tier account
The free tier account comes with 10 free dashboards quota, that’s enough for my simple use case. I choose to use Grafana cloud for building the dashboard to avoid the trouble of getting into the Pi cluster to access the local Grafana instance. Also, it will be easier for alert integration using Grafana Cloud.
Step 5: Building the dashboard
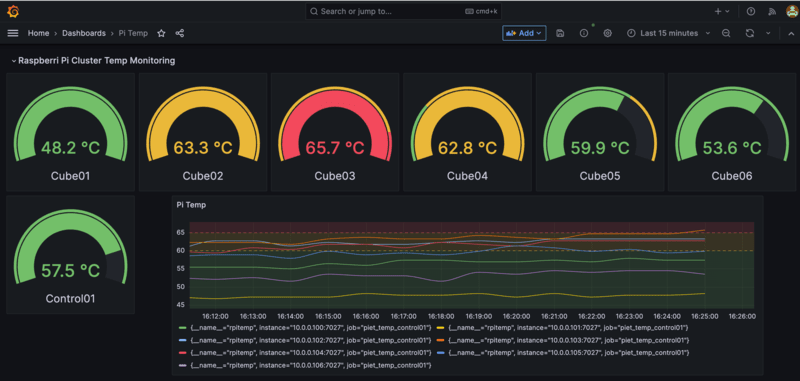
This is probably the easiest part. Grafana comes with nice dash-boarding capability for different kind of use cases. I haven’t finished setting up the alert as I am still struggling how I want to get the alert. Looking at the figures of the dashboard I probably need to open the case for better ventilation or add additional 40mm fans to the bottom or back of the rack for better cooling. Hopefully I can run this cluster 24×7 after solving the temperature issue.
The free tier account comes with 10 free dashboards quota, that’s enough for my simple use case. I choose to use Grafana cloud for building the dashboard to avoid the trouble of getting into the Pi cluster to access the local Grafana instance. Also, it will be easier for alert integration using Grafana Cloud.
Conclusion
This is an interesting side project outside of the K8S cluster on DietPi OS. Raspberry pi’s are common today as SBC for edge computing and remote IoT use cases for digital displays and edge gateways. Remember temperature is another important metric to monitor for your edge computing devices to ensure system availability and reliability.
Head of Solutions Engineering
