Deprecated: Using ${var} in strings is deprecated, use {$var} instead in
/home/devwp/public_html/p225-newweb/wp-content/themes/vsceptre/includes/builder/module/settings/migration/ColumnOptions.php on line
95
Deprecated: Using ${var} in strings is deprecated, use {$var} instead in
/home/devwp/public_html/p225-newweb/wp-content/themes/vsceptre/includes/builder/module/settings/migration/ColumnOptions.php on line
95
Deprecated: Using ${var} in strings is deprecated, use {$var} instead in
/home/devwp/public_html/p225-newweb/wp-content/themes/vsceptre/includes/builder/module/settings/migration/ColumnOptions.php on line
97
Deprecated: Using ${var} in strings is deprecated, use {$var} instead in
/home/devwp/public_html/p225-newweb/wp-content/themes/vsceptre/includes/builder/module/settings/migration/ColumnOptions.php on line
97
Deprecated: Using ${var} in strings is deprecated, use {$var} instead in
/home/devwp/public_html/p225-newweb/wp-content/themes/vsceptre/includes/builder/module/settings/migration/ColumnOptions.php on line
103
Deprecated: Using ${var} in strings is deprecated, use {$var} instead in
/home/devwp/public_html/p225-newweb/wp-content/themes/vsceptre/includes/builder/module/settings/migration/ColumnOptions.php on line
103
Deprecated: Using ${var} in strings is deprecated, use {$var} instead in
/home/devwp/public_html/p225-newweb/wp-content/themes/vsceptre/includes/builder/module/settings/migration/ColumnOptions.php on line
105
Deprecated: Using ${var} in strings is deprecated, use {$var} instead in
/home/devwp/public_html/p225-newweb/wp-content/themes/vsceptre/includes/builder/module/settings/migration/ColumnOptions.php on line
105
Deprecated: Using ${var} in strings is deprecated, use {$var} instead in
/home/devwp/public_html/p225-newweb/wp-content/themes/vsceptre/includes/builder/module/settings/migration/ColumnOptions.php on line
130
Deprecated: Using ${var} in strings is deprecated, use {$var} instead in
/home/devwp/public_html/p225-newweb/wp-content/themes/vsceptre/includes/builder/module/settings/migration/ColumnOptions.php on line
130
Deprecated: Using ${var} in strings is deprecated, use {$var} instead in
/home/devwp/public_html/p225-newweb/wp-content/themes/vsceptre/includes/builder/module/settings/migration/ColumnOptions.php on line
132
Deprecated: Using ${var} in strings is deprecated, use {$var} instead in
/home/devwp/public_html/p225-newweb/wp-content/themes/vsceptre/includes/builder/module/settings/migration/ColumnOptions.php on line
132
Deprecated: Using ${var} in strings is deprecated, use {$var} instead in
/home/devwp/public_html/p225-newweb/wp-content/themes/vsceptre/includes/builder/module/settings/migration/ColumnOptions.php on line
161
Deprecated: Using ${var} in strings is deprecated, use {$var} instead in
/home/devwp/public_html/p225-newweb/wp-content/themes/vsceptre/includes/builder/module/settings/migration/ColumnOptions.php on line
161
Deprecated: Using ${var} in strings is deprecated, use {$var} instead in
/home/devwp/public_html/p225-newweb/wp-content/themes/vsceptre/includes/builder/module/settings/migration/ColumnOptions.php on line
161
Deprecated: Using ${var} in strings is deprecated, use {$var} instead in
/home/devwp/public_html/p225-newweb/wp-content/themes/vsceptre/includes/builder/module/settings/migration/ColumnOptions.php on line
162
Deprecated: Using ${var} in strings is deprecated, use {$var} instead in
/home/devwp/public_html/p225-newweb/wp-content/themes/vsceptre/includes/builder/module/settings/migration/ColumnOptions.php on line
162
Deprecated: Using ${var} in strings is deprecated, use {$var} instead in
/home/devwp/public_html/p225-newweb/wp-content/themes/vsceptre/includes/builder/module/settings/migration/ColumnOptions.php on line
162
Deprecated: Using ${var} in strings is deprecated, use {$var} instead in
/home/devwp/public_html/p225-newweb/wp-content/themes/vsceptre/includes/builder/module/settings/migration/ColumnOptions.php on line
205
Deprecated: Using ${var} in strings is deprecated, use {$var} instead in
/home/devwp/public_html/p225-newweb/wp-content/themes/vsceptre/includes/builder/module/settings/migration/ColumnOptions.php on line
205
Deprecated: Using ${var} in strings is deprecated, use {$var} instead in
/home/devwp/public_html/p225-newweb/wp-content/themes/vsceptre/includes/builder/module/settings/migration/ColumnOptions.php on line
205
Deprecated: Using ${var} in strings is deprecated, use {$var} instead in
/home/devwp/public_html/p225-newweb/wp-content/themes/vsceptre/includes/builder/module/settings/migration/ColumnOptions.php on line
205
Deprecated: Using ${var} in strings is deprecated, use {$var} instead in
/home/devwp/public_html/p225-newweb/wp-content/themes/vsceptre/includes/builder/module/settings/migration/ColumnOptions.php on line
207
Deprecated: Using ${var} in strings is deprecated, use {$var} instead in
/home/devwp/public_html/p225-newweb/wp-content/themes/vsceptre/includes/builder/module/settings/migration/ColumnOptions.php on line
207
Deprecated: Using ${var} in strings is deprecated, use {$var} instead in
/home/devwp/public_html/p225-newweb/wp-content/themes/vsceptre/includes/builder/module/settings/migration/ColumnOptions.php on line
207
Deprecated: Creation of dynamic property ET_Builder_Section::$_original_content is deprecated in
/home/devwp/public_html/p225-newweb/wp-content/themes/vsceptre/includes/builder/class-et-builder-element.php on line
1315
Deprecated: Creation of dynamic property ET_Builder_Module_Helper_MultiViewOptions::$inherited_props is deprecated in
/home/devwp/public_html/p225-newweb/wp-content/themes/vsceptre/includes/builder/module/helpers/MultiViewOptions.php on line
686
Deprecated: Creation of dynamic property ET_Builder_Module_Field_Divider::$count is deprecated in
/home/devwp/public_html/p225-newweb/wp-content/themes/vsceptre/includes/builder/main-structure-elements.php on line
1498
Deprecated: Creation of dynamic property ET_Builder_Row::$_original_content is deprecated in
/home/devwp/public_html/p225-newweb/wp-content/themes/vsceptre/includes/builder/class-et-builder-element.php on line
1315
Deprecated: Creation of dynamic property ET_Builder_Column::$_original_content is deprecated in
/home/devwp/public_html/p225-newweb/wp-content/themes/vsceptre/includes/builder/class-et-builder-element.php on line
1315
Deprecated: Creation of dynamic property ET_Builder_Module_Text::$text_shadow is deprecated in
/home/devwp/public_html/p225-newweb/wp-content/themes/vsceptre/includes/builder/class-et-builder-element.php on line
1315
Deprecated: Creation of dynamic property ET_Builder_Module_Text::$margin_padding is deprecated in
/home/devwp/public_html/p225-newweb/wp-content/themes/vsceptre/includes/builder/class-et-builder-element.php on line
1315
Deprecated: Creation of dynamic property ET_Builder_Module_Text::$_additional_fields_options is deprecated in
/home/devwp/public_html/p225-newweb/wp-content/themes/vsceptre/includes/builder/class-et-builder-element.php on line
1315
Deprecated: Creation of dynamic property ET_Builder_Module_Text::$_original_content is deprecated in
/home/devwp/public_html/p225-newweb/wp-content/themes/vsceptre/includes/builder/class-et-builder-element.php on line
1315
Deprecated: Creation of dynamic property ET_Builder_Module_Helper_MultiViewOptions::$inherited_props is deprecated in
/home/devwp/public_html/p225-newweb/wp-content/themes/vsceptre/includes/builder/module/helpers/MultiViewOptions.php on line
686
Deprecated: Creation of dynamic property ET_Builder_Module_Menu::$text_shadow is deprecated in
/home/devwp/public_html/p225-newweb/wp-content/themes/vsceptre/includes/builder/class-et-builder-element.php on line
1315
Deprecated: Creation of dynamic property ET_Builder_Module_Menu::$margin_padding is deprecated in
/home/devwp/public_html/p225-newweb/wp-content/themes/vsceptre/includes/builder/class-et-builder-element.php on line
1315
Deprecated: Creation of dynamic property ET_Builder_Module_Menu::$_additional_fields_options is deprecated in
/home/devwp/public_html/p225-newweb/wp-content/themes/vsceptre/includes/builder/class-et-builder-element.php on line
1315
Deprecated: Creation of dynamic property ET_Builder_Module_Menu::$_original_content is deprecated in
/home/devwp/public_html/p225-newweb/wp-content/themes/vsceptre/includes/builder/class-et-builder-element.php on line
1315
Deprecated: Creation of dynamic property WPML_LS_Menu_Item::$current is deprecated in
/home/devwp/public_html/p225-newweb/wp-includes/nav-menu-template.php on line
399
Deprecated: Creation of dynamic property WPML_LS_Menu_Item::$current is deprecated in
/home/devwp/public_html/p225-newweb/wp-includes/nav-menu-template.php on line
399
Deprecated: Creation of dynamic property WPML_LS_Menu_Item::$current is deprecated in
/home/devwp/public_html/p225-newweb/wp-includes/nav-menu-template.php on line
399
Deprecated: Creation of dynamic property WPML_LS_Menu_Item::$current_item_ancestor is deprecated in
/home/devwp/public_html/p225-newweb/wp-includes/nav-menu-template.php on line
545
Deprecated: Creation of dynamic property WPML_LS_Menu_Item::$current_item_parent is deprecated in
/home/devwp/public_html/p225-newweb/wp-includes/nav-menu-template.php on line
546
Deprecated: Creation of dynamic property ET_Builder_Module_Helper_MultiViewOptions::$inherited_props is deprecated in
/home/devwp/public_html/p225-newweb/wp-content/themes/vsceptre/includes/builder/module/helpers/MultiViewOptions.php on line
686
Deprecated: Creation of dynamic property ET_Builder_Module_Helper_MultiViewOptions::$inherited_props is deprecated in
/home/devwp/public_html/p225-newweb/wp-content/themes/vsceptre/includes/builder/module/helpers/MultiViewOptions.php on line
686
Deprecated: Creation of dynamic property ET_Builder_Module_Helper_MultiViewOptions::$inherited_props is deprecated in
/home/devwp/public_html/p225-newweb/wp-content/themes/vsceptre/includes/builder/module/helpers/MultiViewOptions.php on line
686
Deprecated: Creation of dynamic property ET_Builder_Module_Search::$text_shadow is deprecated in
/home/devwp/public_html/p225-newweb/wp-content/themes/vsceptre/includes/builder/class-et-builder-element.php on line
1315
Deprecated: Creation of dynamic property ET_Builder_Module_Search::$margin_padding is deprecated in
/home/devwp/public_html/p225-newweb/wp-content/themes/vsceptre/includes/builder/class-et-builder-element.php on line
1315
Deprecated: Creation of dynamic property ET_Builder_Module_Search::$_additional_fields_options is deprecated in
/home/devwp/public_html/p225-newweb/wp-content/themes/vsceptre/includes/builder/class-et-builder-element.php on line
1315
Deprecated: Creation of dynamic property ET_Builder_Module_Image::$text_shadow is deprecated in
/home/devwp/public_html/p225-newweb/wp-content/themes/vsceptre/includes/builder/class-et-builder-element.php on line
1315
Deprecated: Creation of dynamic property ET_Builder_Module_Image::$margin_padding is deprecated in
/home/devwp/public_html/p225-newweb/wp-content/themes/vsceptre/includes/builder/class-et-builder-element.php on line
1315
Deprecated: Creation of dynamic property ET_Builder_Module_Image::$_additional_fields_options is deprecated in
/home/devwp/public_html/p225-newweb/wp-content/themes/vsceptre/includes/builder/class-et-builder-element.php on line
1315
Deprecated: Creation of dynamic property ET_Builder_Module_Image::$_original_content is deprecated in
/home/devwp/public_html/p225-newweb/wp-content/themes/vsceptre/includes/builder/class-et-builder-element.php on line
1315
Deprecated: Creation of dynamic property ET_Builder_Module_Helper_MultiViewOptions::$inherited_props is deprecated in
/home/devwp/public_html/p225-newweb/wp-content/themes/vsceptre/includes/builder/module/helpers/MultiViewOptions.php on line
686
Deprecated: Creation of dynamic property ET_Builder_Module_Helper_MultiViewOptions::$inherited_props is deprecated in
/home/devwp/public_html/p225-newweb/wp-content/themes/vsceptre/includes/builder/module/helpers/MultiViewOptions.php on line
686
Deprecated: Creation of dynamic property ET_Builder_Module_Helper_MultiViewOptions::$inherited_props is deprecated in
/home/devwp/public_html/p225-newweb/wp-content/themes/vsceptre/includes/builder/module/helpers/MultiViewOptions.php on line
686
Deprecated: Creation of dynamic property ET_Builder_Module_Helper_MultiViewOptions::$inherited_props is deprecated in
/home/devwp/public_html/p225-newweb/wp-content/themes/vsceptre/includes/builder/module/helpers/MultiViewOptions.php on line
686
Deprecated: Creation of dynamic property ET_Builder_Module_Helper_MultiViewOptions::$inherited_props is deprecated in
/home/devwp/public_html/p225-newweb/wp-content/themes/vsceptre/includes/builder/module/helpers/MultiViewOptions.php on line
686
Deprecated: Creation of dynamic property ET_Builder_Module_Search::$_original_content is deprecated in
/home/devwp/public_html/p225-newweb/wp-content/themes/vsceptre/includes/builder/class-et-builder-element.php on line
1315
Deprecated: Creation of dynamic property ET_Builder_Module_Helper_MultiViewOptions::$inherited_props is deprecated in
/home/devwp/public_html/p225-newweb/wp-content/themes/vsceptre/includes/builder/module/helpers/MultiViewOptions.php on line
686
Deprecated: Creation of dynamic property ET_Builder_Module_Helper_MultiViewOptions::$inherited_props is deprecated in
/home/devwp/public_html/p225-newweb/wp-content/themes/vsceptre/includes/builder/module/helpers/MultiViewOptions.php on line
686
Deprecated: Creation of dynamic property ET_Builder_Module_Helper_MultiViewOptions::$inherited_props is deprecated in
/home/devwp/public_html/p225-newweb/wp-content/themes/vsceptre/includes/builder/module/helpers/MultiViewOptions.php on line
686
Deprecated: Creation of dynamic property ET_Builder_Module_Helper_MultiViewOptions::$inherited_props is deprecated in
/home/devwp/public_html/p225-newweb/wp-content/themes/vsceptre/includes/builder/module/helpers/MultiViewOptions.php on line
686
Deprecated: Creation of dynamic property ET_Builder_Module_Helper_MultiViewOptions::$inherited_props is deprecated in
/home/devwp/public_html/p225-newweb/wp-content/themes/vsceptre/includes/builder/module/helpers/MultiViewOptions.php on line
686
Deprecated: Creation of dynamic property ET_Builder_Module_Helper_MultiViewOptions::$inherited_props is deprecated in
/home/devwp/public_html/p225-newweb/wp-content/themes/vsceptre/includes/builder/module/helpers/MultiViewOptions.php on line
686
Deprecated: Creation of dynamic property WPML_LS_Menu_Item::$current is deprecated in
/home/devwp/public_html/p225-newweb/wp-includes/nav-menu-template.php on line
399
Deprecated: Creation of dynamic property WPML_LS_Menu_Item::$current is deprecated in
/home/devwp/public_html/p225-newweb/wp-includes/nav-menu-template.php on line
399
Deprecated: Creation of dynamic property WPML_LS_Menu_Item::$current is deprecated in
/home/devwp/public_html/p225-newweb/wp-includes/nav-menu-template.php on line
399
Deprecated: Creation of dynamic property WPML_LS_Menu_Item::$current_item_ancestor is deprecated in
/home/devwp/public_html/p225-newweb/wp-includes/nav-menu-template.php on line
545
Deprecated: Creation of dynamic property WPML_LS_Menu_Item::$current_item_parent is deprecated in
/home/devwp/public_html/p225-newweb/wp-includes/nav-menu-template.php on line
546
Deprecated: Creation of dynamic property ET_Builder_Module_Helper_MultiViewOptions::$inherited_props is deprecated in
/home/devwp/public_html/p225-newweb/wp-content/themes/vsceptre/includes/builder/module/helpers/MultiViewOptions.php on line
686
Deprecated: Creation of dynamic property ET_Builder_Module_Helper_MultiViewOptions::$inherited_props is deprecated in
/home/devwp/public_html/p225-newweb/wp-content/themes/vsceptre/includes/builder/module/helpers/MultiViewOptions.php on line
686
Deprecated: Creation of dynamic property ET_Builder_Module_Helper_MultiViewOptions::$inherited_props is deprecated in
/home/devwp/public_html/p225-newweb/wp-content/themes/vsceptre/includes/builder/module/helpers/MultiViewOptions.php on line
686
Deprecated: Creation of dynamic property ET_Builder_Module_Helper_MultiViewOptions::$inherited_props is deprecated in
/home/devwp/public_html/p225-newweb/wp-content/themes/vsceptre/includes/builder/module/helpers/MultiViewOptions.php on line
686
Deprecated: Creation of dynamic property ET_Builder_Module_Helper_MultiViewOptions::$inherited_props is deprecated in
/home/devwp/public_html/p225-newweb/wp-content/themes/vsceptre/includes/builder/module/helpers/MultiViewOptions.php on line
686
Deprecated: Creation of dynamic property ET_Builder_Module_Helper_MultiViewOptions::$inherited_props is deprecated in
/home/devwp/public_html/p225-newweb/wp-content/themes/vsceptre/includes/builder/module/helpers/MultiViewOptions.php on line
686
Deprecated: Creation of dynamic property ET_Builder_Module_Code::$text_shadow is deprecated in
/home/devwp/public_html/p225-newweb/wp-content/themes/vsceptre/includes/builder/class-et-builder-element.php on line
1315
Deprecated: Creation of dynamic property ET_Builder_Module_Code::$margin_padding is deprecated in
/home/devwp/public_html/p225-newweb/wp-content/themes/vsceptre/includes/builder/class-et-builder-element.php on line
1315
Deprecated: Creation of dynamic property ET_Builder_Module_Code::$_additional_fields_options is deprecated in
/home/devwp/public_html/p225-newweb/wp-content/themes/vsceptre/includes/builder/class-et-builder-element.php on line
1315
Deprecated: Creation of dynamic property ET_Builder_Module_Code::$_original_content is deprecated in
/home/devwp/public_html/p225-newweb/wp-content/themes/vsceptre/includes/builder/class-et-builder-element.php on line
1315
Deprecated: Creation of dynamic property ET_Builder_Module_Helper_MultiViewOptions::$inherited_props is deprecated in
/home/devwp/public_html/p225-newweb/wp-content/themes/vsceptre/includes/builder/module/helpers/MultiViewOptions.php on line
686
Deprecated: Creation of dynamic property ET_Builder_Module_Helper_MultiViewOptions::$inherited_props is deprecated in
/home/devwp/public_html/p225-newweb/wp-content/themes/vsceptre/includes/builder/module/helpers/MultiViewOptions.php on line
686
Deprecated: Creation of dynamic property ET_Builder_Module_Helper_MultiViewOptions::$inherited_props is deprecated in
/home/devwp/public_html/p225-newweb/wp-content/themes/vsceptre/includes/builder/module/helpers/MultiViewOptions.php on line
686
Deprecated: Creation of dynamic property ET_Builder_Module_Helper_MultiViewOptions::$inherited_props is deprecated in
/home/devwp/public_html/p225-newweb/wp-content/themes/vsceptre/includes/builder/module/helpers/MultiViewOptions.php on line
686
Deprecated: Creation of dynamic property ET_Builder_Module_Helper_MultiViewOptions::$inherited_props is deprecated in
/home/devwp/public_html/p225-newweb/wp-content/themes/vsceptre/includes/builder/module/helpers/MultiViewOptions.php on line
686
Deprecated: Creation of dynamic property ET_Builder_Module_PostContent::$text_shadow is deprecated in
/home/devwp/public_html/p225-newweb/wp-content/themes/vsceptre/includes/builder/class-et-builder-element.php on line
1315
Deprecated: Creation of dynamic property ET_Builder_Module_PostContent::$margin_padding is deprecated in
/home/devwp/public_html/p225-newweb/wp-content/themes/vsceptre/includes/builder/class-et-builder-element.php on line
1315
Deprecated: Creation of dynamic property ET_Builder_Module_PostContent::$_additional_fields_options is deprecated in
/home/devwp/public_html/p225-newweb/wp-content/themes/vsceptre/includes/builder/class-et-builder-element.php on line
1315
Deprecated: Creation of dynamic property ET_Builder_Module_PostContent::$_original_content is deprecated in
/home/devwp/public_html/p225-newweb/wp-content/themes/vsceptre/includes/builder/class-et-builder-element.php on line
1315
Deprecated: Creation of dynamic property ET_Builder_Module_Helper_MultiViewOptions::$inherited_props is deprecated in
/home/devwp/public_html/p225-newweb/wp-content/themes/vsceptre/includes/builder/module/helpers/MultiViewOptions.php on line
686
Deprecated: Creation of dynamic property ET_Builder_Module_Helper_MultiViewOptions::$inherited_props is deprecated in
/home/devwp/public_html/p225-newweb/wp-content/themes/vsceptre/includes/builder/module/helpers/MultiViewOptions.php on line
686
Deprecated: Creation of dynamic property ET_Builder_Module_Blog::$text_shadow is deprecated in
/home/devwp/public_html/p225-newweb/wp-content/themes/vsceptre/includes/builder/class-et-builder-element.php on line
1315
Deprecated: Creation of dynamic property ET_Builder_Module_Blog::$margin_padding is deprecated in
/home/devwp/public_html/p225-newweb/wp-content/themes/vsceptre/includes/builder/class-et-builder-element.php on line
1315
Deprecated: Creation of dynamic property ET_Builder_Module_Blog::$_additional_fields_options is deprecated in
/home/devwp/public_html/p225-newweb/wp-content/themes/vsceptre/includes/builder/class-et-builder-element.php on line
1315
Deprecated: Creation of dynamic property ET_Builder_Module_Blog::$_original_content is deprecated in
/home/devwp/public_html/p225-newweb/wp-content/themes/vsceptre/includes/builder/class-et-builder-element.php on line
1315
Deprecated: Creation of dynamic property ET_Builder_Module_Helper_MultiViewOptions::$inherited_props is deprecated in
/home/devwp/public_html/p225-newweb/wp-content/themes/vsceptre/includes/builder/module/helpers/MultiViewOptions.php on line
686
How to identify the golden metrics for SRE
How to identify the golden metrics for SRE
Deprecated: Creation of dynamic property ET_Builder_Module_Helper_MultiViewOptions::$inherited_props is deprecated in
/home/devwp/public_html/p225-newweb/wp-content/themes/vsceptre/includes/builder/module/helpers/MultiViewOptions.php on line
686
Deprecated: Creation of dynamic property ET_Builder_Module_Helper_MultiViewOptions::$inherited_props is deprecated in
/home/devwp/public_html/p225-newweb/wp-content/themes/vsceptre/includes/builder/module/helpers/MultiViewOptions.php on line
686
This is part 1 of the 3 part series “The path to your first SLO”.
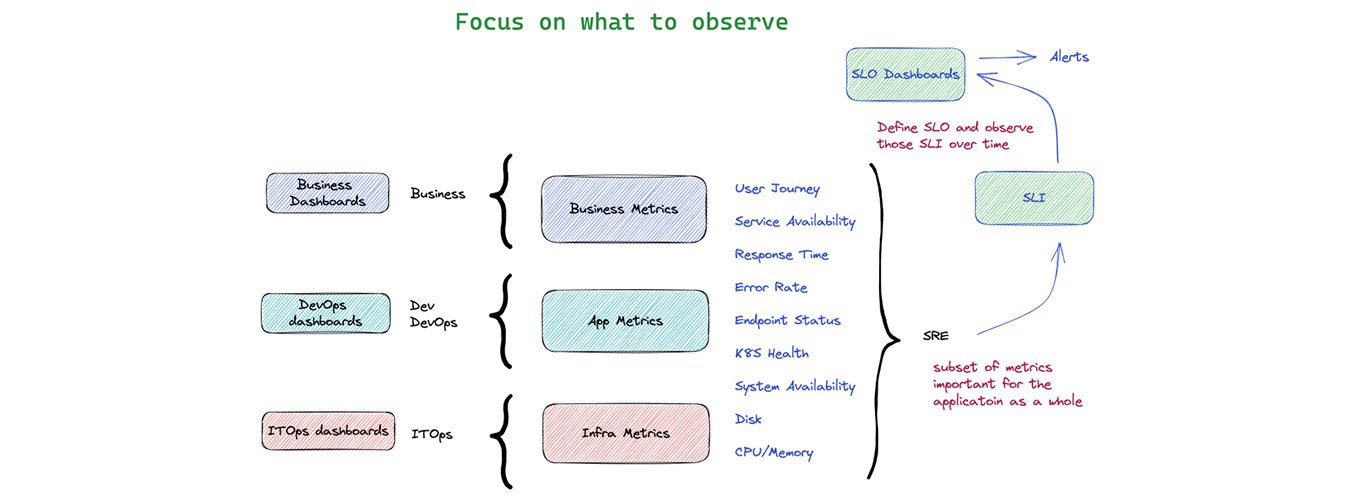
When talking about building an observability practice, many customers we talked to struggled on what to observe and usually frustrated with the alarm storms or false alarms. ITOps are concerned about centralized monitoring and gather metrics from different systems for proactive monitoring. App Owners are interested in the ability for fast root cause analysis and end-to-end tracing capabilities. Usually the ITOps take the role of first tier monitoring on the vital health signals of different systems and alert the right app teams for in-depth diagnostics.
The requirements are clear. Applications need to supply the right metrics to ITOps. That may range from simple system up/down availability metrics, K8s metrics, CPU/Memory utilization to disk consumption information. The challenge usually comes from gathering application metrics from the app layer. No matter what monitoring tools you use the following golden signals for observability are usually what you need.
Latency – the request response time
Traffic – the number of requests per second
Errors – the number of errors or error rate
Saturation – the resource constraints on higher loadings
There are in-depth explanations of each of these all over the web so we do not repeat the details here. The important thing is to observe all 4 signals for each “user journey” or “service endpoint”. As an example, for an ecommerce application, that will be the user journey of “Login”, “Browse Catalog”, “Add to Cart” and “Checkout”.
These high level metrics are what we called “Work metrics”. Combined together with the lower level system metrics – “Resource metrics”. From here, organizations can define the important SLOs (Service Level Objectives) and how to monitor and meet those SLOs with the selected SLIs (Service Level Indicators). These SLIs are the metrics of what to set alerts on – to observe what matters most to your organization. In the next article we will talk about common practice to gather these metrics from leading monitoring tools.
New to SLO?
#SLOconf is a free, virtual event focused on #SLOs! 🔥
Whether you are doing SRE, SLO, or DevOps, or Ops, or a Dev – SLOconf is the perfect platform to share insights and ideas on the latest trends and developments in SRE/SLO.
Vsceptre is a sponsor at SLOconf 2023, hosted by Nobl9! 📢
For more details & speaker lineup, register here: 👇
www.sloconf.com


