Insights from our engineering and consulting team
Vsceptre blog

Demystifying Log to Trace correlation in DataDog
At around end of March, I want to get my hands on the old raspberry pi cluster again as I need a testbed for K8S, ChatOps, CI/CD etc. The DevOps ecosystem in 2023 is more ARM ready compared with 2020 which makes building a usable K8S stack on Pi realistic. I upgraded from a 4 nodes cluster to a 7 Pi4 nodes with POE capabilities, SSD, USB and sitting inside a nice 1U rack. Then spending the next two months’ time on testing various OS. Re-installing the whole stack multiple times and struggling with the home router is fun. At the end the cluster is up with all platform engineering tools deployed.
21 Sep 2023
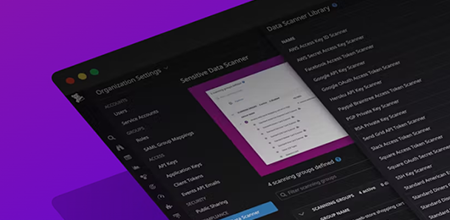
Log Sensitive Data Scrubbing and Scanning on Datadog
In today’s digital landscape, data security and privacy have become paramount concerns for businesses and individuals alike. With the increasing reliance on cloud-based services and the need to monitor and analyze application logs, it is crucial to ensure that sensitive data remains protected. Datadog offers robust features to help organizations track and analyze their logs effectively.
6 Sep 2023
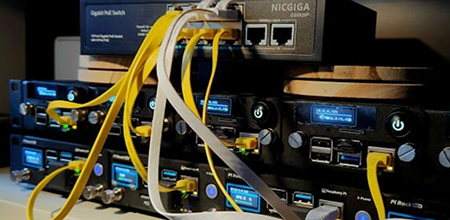
Monitoring temperature of my DietPi Homelab cluster with Grafana Cloud
At around end of March, I want to get my hands on the old raspberry pi cluster again as I need a testbed for K8S, ChatOps, CI/CD etc. The DevOps ecosystem in 2023 is more ARM ready compared with 2020 which makes building a usable K8S stack on Pi realistic. I upgraded from a 4 nodes cluster to a 7 Pi4 nodes with POE capabilities, SSD, USB and sitting inside a nice 1U rack. Then spending the next two months’ time on testing various OS. Re-installing the whole stack multiple times and struggling with the home router is fun. At the end the cluster is up with all platform engineering tools deployed.
20 Aug 2023

Setting up the first SLO
This is the final piece of the 3 part series “The path to your first SLO”.
We have discussed on the basics of what to observe and how to get the relevant metrics in part 1 and part 2 of this series. This time we are going to have a quick look on to setup a simple service availability monitoring SLO with Nobl9 and SolarWinds Pingdom.
10 May 2023
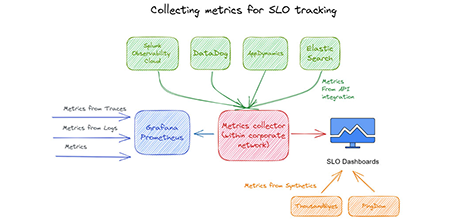
How to obtain the metrics for SLO tracking
This is part 2 of the 3 part series “The path to your first SLO”.
When you have a clear understanding of what metrics to gather for SLO, the next question is how to obtain and gather those metrics. Basically the metrics can be obtained by the following methods.
5 May 2023
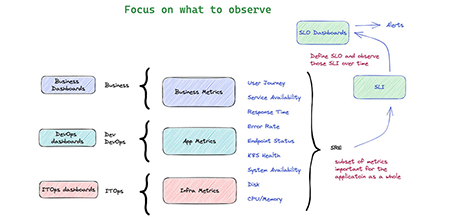
How to identify the golden metrics for SRE
This is part 1 of the 3 part series “The path to your first SLO”.
When talking about building an observability practice, many customers we talked to struggled on what to observe and usually frustrated with the alarm storms or false alarms. ITOps are concerned about centralized monitoring and gather metrics from different systems for proactive monitoring. App Owners are interested in the ability for fast root cause analysis and end-to-end tracing capabilities. Usually the ITOps take the role of first tier monitoring on the vital health signals of different systems and alert the right app teams for in-depth diagnostics.
29 Apr 2023