Deprecated: Using ${var} in strings is deprecated, use {$var} instead in
/home/devwp/public_html/p225-newweb/wp-content/themes/vsceptre/includes/builder/module/settings/migration/ColumnOptions.php on line
95
Deprecated: Using ${var} in strings is deprecated, use {$var} instead in
/home/devwp/public_html/p225-newweb/wp-content/themes/vsceptre/includes/builder/module/settings/migration/ColumnOptions.php on line
95
Deprecated: Using ${var} in strings is deprecated, use {$var} instead in
/home/devwp/public_html/p225-newweb/wp-content/themes/vsceptre/includes/builder/module/settings/migration/ColumnOptions.php on line
97
Deprecated: Using ${var} in strings is deprecated, use {$var} instead in
/home/devwp/public_html/p225-newweb/wp-content/themes/vsceptre/includes/builder/module/settings/migration/ColumnOptions.php on line
97
Deprecated: Using ${var} in strings is deprecated, use {$var} instead in
/home/devwp/public_html/p225-newweb/wp-content/themes/vsceptre/includes/builder/module/settings/migration/ColumnOptions.php on line
103
Deprecated: Using ${var} in strings is deprecated, use {$var} instead in
/home/devwp/public_html/p225-newweb/wp-content/themes/vsceptre/includes/builder/module/settings/migration/ColumnOptions.php on line
103
Deprecated: Using ${var} in strings is deprecated, use {$var} instead in
/home/devwp/public_html/p225-newweb/wp-content/themes/vsceptre/includes/builder/module/settings/migration/ColumnOptions.php on line
105
Deprecated: Using ${var} in strings is deprecated, use {$var} instead in
/home/devwp/public_html/p225-newweb/wp-content/themes/vsceptre/includes/builder/module/settings/migration/ColumnOptions.php on line
105
Deprecated: Using ${var} in strings is deprecated, use {$var} instead in
/home/devwp/public_html/p225-newweb/wp-content/themes/vsceptre/includes/builder/module/settings/migration/ColumnOptions.php on line
130
Deprecated: Using ${var} in strings is deprecated, use {$var} instead in
/home/devwp/public_html/p225-newweb/wp-content/themes/vsceptre/includes/builder/module/settings/migration/ColumnOptions.php on line
130
Deprecated: Using ${var} in strings is deprecated, use {$var} instead in
/home/devwp/public_html/p225-newweb/wp-content/themes/vsceptre/includes/builder/module/settings/migration/ColumnOptions.php on line
132
Deprecated: Using ${var} in strings is deprecated, use {$var} instead in
/home/devwp/public_html/p225-newweb/wp-content/themes/vsceptre/includes/builder/module/settings/migration/ColumnOptions.php on line
132
Deprecated: Using ${var} in strings is deprecated, use {$var} instead in
/home/devwp/public_html/p225-newweb/wp-content/themes/vsceptre/includes/builder/module/settings/migration/ColumnOptions.php on line
161
Deprecated: Using ${var} in strings is deprecated, use {$var} instead in
/home/devwp/public_html/p225-newweb/wp-content/themes/vsceptre/includes/builder/module/settings/migration/ColumnOptions.php on line
161
Deprecated: Using ${var} in strings is deprecated, use {$var} instead in
/home/devwp/public_html/p225-newweb/wp-content/themes/vsceptre/includes/builder/module/settings/migration/ColumnOptions.php on line
161
Deprecated: Using ${var} in strings is deprecated, use {$var} instead in
/home/devwp/public_html/p225-newweb/wp-content/themes/vsceptre/includes/builder/module/settings/migration/ColumnOptions.php on line
162
Deprecated: Using ${var} in strings is deprecated, use {$var} instead in
/home/devwp/public_html/p225-newweb/wp-content/themes/vsceptre/includes/builder/module/settings/migration/ColumnOptions.php on line
162
Deprecated: Using ${var} in strings is deprecated, use {$var} instead in
/home/devwp/public_html/p225-newweb/wp-content/themes/vsceptre/includes/builder/module/settings/migration/ColumnOptions.php on line
162
Deprecated: Using ${var} in strings is deprecated, use {$var} instead in
/home/devwp/public_html/p225-newweb/wp-content/themes/vsceptre/includes/builder/module/settings/migration/ColumnOptions.php on line
205
Deprecated: Using ${var} in strings is deprecated, use {$var} instead in
/home/devwp/public_html/p225-newweb/wp-content/themes/vsceptre/includes/builder/module/settings/migration/ColumnOptions.php on line
205
Deprecated: Using ${var} in strings is deprecated, use {$var} instead in
/home/devwp/public_html/p225-newweb/wp-content/themes/vsceptre/includes/builder/module/settings/migration/ColumnOptions.php on line
205
Deprecated: Using ${var} in strings is deprecated, use {$var} instead in
/home/devwp/public_html/p225-newweb/wp-content/themes/vsceptre/includes/builder/module/settings/migration/ColumnOptions.php on line
205
Deprecated: Using ${var} in strings is deprecated, use {$var} instead in
/home/devwp/public_html/p225-newweb/wp-content/themes/vsceptre/includes/builder/module/settings/migration/ColumnOptions.php on line
207
Deprecated: Using ${var} in strings is deprecated, use {$var} instead in
/home/devwp/public_html/p225-newweb/wp-content/themes/vsceptre/includes/builder/module/settings/migration/ColumnOptions.php on line
207
Deprecated: Using ${var} in strings is deprecated, use {$var} instead in
/home/devwp/public_html/p225-newweb/wp-content/themes/vsceptre/includes/builder/module/settings/migration/ColumnOptions.php on line
207
Deprecated: Creation of dynamic property ET_Builder_Section::$_original_content is deprecated in
/home/devwp/public_html/p225-newweb/wp-content/themes/vsceptre/includes/builder/class-et-builder-element.php on line
1315
Deprecated: Creation of dynamic property ET_Builder_Module_Helper_MultiViewOptions::$inherited_props is deprecated in
/home/devwp/public_html/p225-newweb/wp-content/themes/vsceptre/includes/builder/module/helpers/MultiViewOptions.php on line
686
Deprecated: Creation of dynamic property ET_Builder_Module_Field_Divider::$count is deprecated in
/home/devwp/public_html/p225-newweb/wp-content/themes/vsceptre/includes/builder/main-structure-elements.php on line
1498
Deprecated: Creation of dynamic property ET_Builder_Row::$_original_content is deprecated in
/home/devwp/public_html/p225-newweb/wp-content/themes/vsceptre/includes/builder/class-et-builder-element.php on line
1315
Deprecated: Creation of dynamic property ET_Builder_Column::$_original_content is deprecated in
/home/devwp/public_html/p225-newweb/wp-content/themes/vsceptre/includes/builder/class-et-builder-element.php on line
1315
Deprecated: Creation of dynamic property ET_Builder_Module_Text::$text_shadow is deprecated in
/home/devwp/public_html/p225-newweb/wp-content/themes/vsceptre/includes/builder/class-et-builder-element.php on line
1315
Deprecated: Creation of dynamic property ET_Builder_Module_Text::$margin_padding is deprecated in
/home/devwp/public_html/p225-newweb/wp-content/themes/vsceptre/includes/builder/class-et-builder-element.php on line
1315
Deprecated: Creation of dynamic property ET_Builder_Module_Text::$_additional_fields_options is deprecated in
/home/devwp/public_html/p225-newweb/wp-content/themes/vsceptre/includes/builder/class-et-builder-element.php on line
1315
Deprecated: Creation of dynamic property ET_Builder_Module_Text::$_original_content is deprecated in
/home/devwp/public_html/p225-newweb/wp-content/themes/vsceptre/includes/builder/class-et-builder-element.php on line
1315
Deprecated: Creation of dynamic property ET_Builder_Module_Helper_MultiViewOptions::$inherited_props is deprecated in
/home/devwp/public_html/p225-newweb/wp-content/themes/vsceptre/includes/builder/module/helpers/MultiViewOptions.php on line
686
Deprecated: Creation of dynamic property ET_Builder_Module_Menu::$text_shadow is deprecated in
/home/devwp/public_html/p225-newweb/wp-content/themes/vsceptre/includes/builder/class-et-builder-element.php on line
1315
Deprecated: Creation of dynamic property ET_Builder_Module_Menu::$margin_padding is deprecated in
/home/devwp/public_html/p225-newweb/wp-content/themes/vsceptre/includes/builder/class-et-builder-element.php on line
1315
Deprecated: Creation of dynamic property ET_Builder_Module_Menu::$_additional_fields_options is deprecated in
/home/devwp/public_html/p225-newweb/wp-content/themes/vsceptre/includes/builder/class-et-builder-element.php on line
1315
Deprecated: Creation of dynamic property ET_Builder_Module_Menu::$_original_content is deprecated in
/home/devwp/public_html/p225-newweb/wp-content/themes/vsceptre/includes/builder/class-et-builder-element.php on line
1315
Deprecated: Creation of dynamic property WPML_LS_Menu_Item::$current is deprecated in
/home/devwp/public_html/p225-newweb/wp-includes/nav-menu-template.php on line
399
Deprecated: Creation of dynamic property WPML_LS_Menu_Item::$current is deprecated in
/home/devwp/public_html/p225-newweb/wp-includes/nav-menu-template.php on line
399
Deprecated: Creation of dynamic property WPML_LS_Menu_Item::$current is deprecated in
/home/devwp/public_html/p225-newweb/wp-includes/nav-menu-template.php on line
399
Deprecated: Creation of dynamic property WPML_LS_Menu_Item::$current_item_ancestor is deprecated in
/home/devwp/public_html/p225-newweb/wp-includes/nav-menu-template.php on line
545
Deprecated: Creation of dynamic property WPML_LS_Menu_Item::$current_item_parent is deprecated in
/home/devwp/public_html/p225-newweb/wp-includes/nav-menu-template.php on line
546
Deprecated: Creation of dynamic property ET_Builder_Module_Helper_MultiViewOptions::$inherited_props is deprecated in
/home/devwp/public_html/p225-newweb/wp-content/themes/vsceptre/includes/builder/module/helpers/MultiViewOptions.php on line
686
Deprecated: Creation of dynamic property ET_Builder_Module_Helper_MultiViewOptions::$inherited_props is deprecated in
/home/devwp/public_html/p225-newweb/wp-content/themes/vsceptre/includes/builder/module/helpers/MultiViewOptions.php on line
686
Deprecated: Creation of dynamic property ET_Builder_Module_Helper_MultiViewOptions::$inherited_props is deprecated in
/home/devwp/public_html/p225-newweb/wp-content/themes/vsceptre/includes/builder/module/helpers/MultiViewOptions.php on line
686
Deprecated: Creation of dynamic property ET_Builder_Module_Search::$text_shadow is deprecated in
/home/devwp/public_html/p225-newweb/wp-content/themes/vsceptre/includes/builder/class-et-builder-element.php on line
1315
Deprecated: Creation of dynamic property ET_Builder_Module_Search::$margin_padding is deprecated in
/home/devwp/public_html/p225-newweb/wp-content/themes/vsceptre/includes/builder/class-et-builder-element.php on line
1315
Deprecated: Creation of dynamic property ET_Builder_Module_Search::$_additional_fields_options is deprecated in
/home/devwp/public_html/p225-newweb/wp-content/themes/vsceptre/includes/builder/class-et-builder-element.php on line
1315
Deprecated: Creation of dynamic property ET_Builder_Module_Image::$text_shadow is deprecated in
/home/devwp/public_html/p225-newweb/wp-content/themes/vsceptre/includes/builder/class-et-builder-element.php on line
1315
Deprecated: Creation of dynamic property ET_Builder_Module_Image::$margin_padding is deprecated in
/home/devwp/public_html/p225-newweb/wp-content/themes/vsceptre/includes/builder/class-et-builder-element.php on line
1315
Deprecated: Creation of dynamic property ET_Builder_Module_Image::$_additional_fields_options is deprecated in
/home/devwp/public_html/p225-newweb/wp-content/themes/vsceptre/includes/builder/class-et-builder-element.php on line
1315
Deprecated: Creation of dynamic property ET_Builder_Module_Image::$_original_content is deprecated in
/home/devwp/public_html/p225-newweb/wp-content/themes/vsceptre/includes/builder/class-et-builder-element.php on line
1315
Deprecated: Creation of dynamic property ET_Builder_Module_Helper_MultiViewOptions::$inherited_props is deprecated in
/home/devwp/public_html/p225-newweb/wp-content/themes/vsceptre/includes/builder/module/helpers/MultiViewOptions.php on line
686
Deprecated: Creation of dynamic property ET_Builder_Module_Helper_MultiViewOptions::$inherited_props is deprecated in
/home/devwp/public_html/p225-newweb/wp-content/themes/vsceptre/includes/builder/module/helpers/MultiViewOptions.php on line
686
Deprecated: Creation of dynamic property ET_Builder_Module_Helper_MultiViewOptions::$inherited_props is deprecated in
/home/devwp/public_html/p225-newweb/wp-content/themes/vsceptre/includes/builder/module/helpers/MultiViewOptions.php on line
686
Deprecated: Creation of dynamic property ET_Builder_Module_Helper_MultiViewOptions::$inherited_props is deprecated in
/home/devwp/public_html/p225-newweb/wp-content/themes/vsceptre/includes/builder/module/helpers/MultiViewOptions.php on line
686
Deprecated: Creation of dynamic property ET_Builder_Module_Helper_MultiViewOptions::$inherited_props is deprecated in
/home/devwp/public_html/p225-newweb/wp-content/themes/vsceptre/includes/builder/module/helpers/MultiViewOptions.php on line
686
Deprecated: Creation of dynamic property ET_Builder_Module_Search::$_original_content is deprecated in
/home/devwp/public_html/p225-newweb/wp-content/themes/vsceptre/includes/builder/class-et-builder-element.php on line
1315
Deprecated: Creation of dynamic property ET_Builder_Module_Helper_MultiViewOptions::$inherited_props is deprecated in
/home/devwp/public_html/p225-newweb/wp-content/themes/vsceptre/includes/builder/module/helpers/MultiViewOptions.php on line
686
Deprecated: Creation of dynamic property ET_Builder_Module_Helper_MultiViewOptions::$inherited_props is deprecated in
/home/devwp/public_html/p225-newweb/wp-content/themes/vsceptre/includes/builder/module/helpers/MultiViewOptions.php on line
686
Deprecated: Creation of dynamic property ET_Builder_Module_Helper_MultiViewOptions::$inherited_props is deprecated in
/home/devwp/public_html/p225-newweb/wp-content/themes/vsceptre/includes/builder/module/helpers/MultiViewOptions.php on line
686
Deprecated: Creation of dynamic property ET_Builder_Module_Helper_MultiViewOptions::$inherited_props is deprecated in
/home/devwp/public_html/p225-newweb/wp-content/themes/vsceptre/includes/builder/module/helpers/MultiViewOptions.php on line
686
Deprecated: Creation of dynamic property ET_Builder_Module_Helper_MultiViewOptions::$inherited_props is deprecated in
/home/devwp/public_html/p225-newweb/wp-content/themes/vsceptre/includes/builder/module/helpers/MultiViewOptions.php on line
686
Deprecated: Creation of dynamic property ET_Builder_Module_Helper_MultiViewOptions::$inherited_props is deprecated in
/home/devwp/public_html/p225-newweb/wp-content/themes/vsceptre/includes/builder/module/helpers/MultiViewOptions.php on line
686
Deprecated: Creation of dynamic property WPML_LS_Menu_Item::$current is deprecated in
/home/devwp/public_html/p225-newweb/wp-includes/nav-menu-template.php on line
399
Deprecated: Creation of dynamic property WPML_LS_Menu_Item::$current is deprecated in
/home/devwp/public_html/p225-newweb/wp-includes/nav-menu-template.php on line
399
Deprecated: Creation of dynamic property WPML_LS_Menu_Item::$current is deprecated in
/home/devwp/public_html/p225-newweb/wp-includes/nav-menu-template.php on line
399
Deprecated: Creation of dynamic property WPML_LS_Menu_Item::$current_item_ancestor is deprecated in
/home/devwp/public_html/p225-newweb/wp-includes/nav-menu-template.php on line
545
Deprecated: Creation of dynamic property WPML_LS_Menu_Item::$current_item_parent is deprecated in
/home/devwp/public_html/p225-newweb/wp-includes/nav-menu-template.php on line
546
Deprecated: Creation of dynamic property ET_Builder_Module_Helper_MultiViewOptions::$inherited_props is deprecated in
/home/devwp/public_html/p225-newweb/wp-content/themes/vsceptre/includes/builder/module/helpers/MultiViewOptions.php on line
686
Deprecated: Creation of dynamic property ET_Builder_Module_Helper_MultiViewOptions::$inherited_props is deprecated in
/home/devwp/public_html/p225-newweb/wp-content/themes/vsceptre/includes/builder/module/helpers/MultiViewOptions.php on line
686
Deprecated: Creation of dynamic property ET_Builder_Module_Helper_MultiViewOptions::$inherited_props is deprecated in
/home/devwp/public_html/p225-newweb/wp-content/themes/vsceptre/includes/builder/module/helpers/MultiViewOptions.php on line
686
Deprecated: Creation of dynamic property ET_Builder_Module_Helper_MultiViewOptions::$inherited_props is deprecated in
/home/devwp/public_html/p225-newweb/wp-content/themes/vsceptre/includes/builder/module/helpers/MultiViewOptions.php on line
686
Deprecated: Creation of dynamic property ET_Builder_Module_Helper_MultiViewOptions::$inherited_props is deprecated in
/home/devwp/public_html/p225-newweb/wp-content/themes/vsceptre/includes/builder/module/helpers/MultiViewOptions.php on line
686
Deprecated: Creation of dynamic property ET_Builder_Module_Helper_MultiViewOptions::$inherited_props is deprecated in
/home/devwp/public_html/p225-newweb/wp-content/themes/vsceptre/includes/builder/module/helpers/MultiViewOptions.php on line
686
Deprecated: Creation of dynamic property ET_Builder_Module_Code::$text_shadow is deprecated in
/home/devwp/public_html/p225-newweb/wp-content/themes/vsceptre/includes/builder/class-et-builder-element.php on line
1315
Deprecated: Creation of dynamic property ET_Builder_Module_Code::$margin_padding is deprecated in
/home/devwp/public_html/p225-newweb/wp-content/themes/vsceptre/includes/builder/class-et-builder-element.php on line
1315
Deprecated: Creation of dynamic property ET_Builder_Module_Code::$_additional_fields_options is deprecated in
/home/devwp/public_html/p225-newweb/wp-content/themes/vsceptre/includes/builder/class-et-builder-element.php on line
1315
Deprecated: Creation of dynamic property ET_Builder_Module_Code::$_original_content is deprecated in
/home/devwp/public_html/p225-newweb/wp-content/themes/vsceptre/includes/builder/class-et-builder-element.php on line
1315
Deprecated: Creation of dynamic property ET_Builder_Module_Helper_MultiViewOptions::$inherited_props is deprecated in
/home/devwp/public_html/p225-newweb/wp-content/themes/vsceptre/includes/builder/module/helpers/MultiViewOptions.php on line
686
Deprecated: Creation of dynamic property ET_Builder_Module_Helper_MultiViewOptions::$inherited_props is deprecated in
/home/devwp/public_html/p225-newweb/wp-content/themes/vsceptre/includes/builder/module/helpers/MultiViewOptions.php on line
686
Deprecated: Creation of dynamic property ET_Builder_Module_Helper_MultiViewOptions::$inherited_props is deprecated in
/home/devwp/public_html/p225-newweb/wp-content/themes/vsceptre/includes/builder/module/helpers/MultiViewOptions.php on line
686
Deprecated: Creation of dynamic property ET_Builder_Module_Helper_MultiViewOptions::$inherited_props is deprecated in
/home/devwp/public_html/p225-newweb/wp-content/themes/vsceptre/includes/builder/module/helpers/MultiViewOptions.php on line
686
Deprecated: Creation of dynamic property ET_Builder_Module_Helper_MultiViewOptions::$inherited_props is deprecated in
/home/devwp/public_html/p225-newweb/wp-content/themes/vsceptre/includes/builder/module/helpers/MultiViewOptions.php on line
686
Deprecated: Creation of dynamic property ET_Builder_Module_PostContent::$text_shadow is deprecated in
/home/devwp/public_html/p225-newweb/wp-content/themes/vsceptre/includes/builder/class-et-builder-element.php on line
1315
Deprecated: Creation of dynamic property ET_Builder_Module_PostContent::$margin_padding is deprecated in
/home/devwp/public_html/p225-newweb/wp-content/themes/vsceptre/includes/builder/class-et-builder-element.php on line
1315
Deprecated: Creation of dynamic property ET_Builder_Module_PostContent::$_additional_fields_options is deprecated in
/home/devwp/public_html/p225-newweb/wp-content/themes/vsceptre/includes/builder/class-et-builder-element.php on line
1315
Deprecated: Creation of dynamic property ET_Builder_Module_PostContent::$_original_content is deprecated in
/home/devwp/public_html/p225-newweb/wp-content/themes/vsceptre/includes/builder/class-et-builder-element.php on line
1315
Deprecated: Creation of dynamic property ET_Builder_Module_Helper_MultiViewOptions::$inherited_props is deprecated in
/home/devwp/public_html/p225-newweb/wp-content/themes/vsceptre/includes/builder/module/helpers/MultiViewOptions.php on line
686
Deprecated: Creation of dynamic property ET_Builder_Module_Helper_MultiViewOptions::$inherited_props is deprecated in
/home/devwp/public_html/p225-newweb/wp-content/themes/vsceptre/includes/builder/module/helpers/MultiViewOptions.php on line
686
Deprecated: Creation of dynamic property ET_Builder_Module_Blog::$text_shadow is deprecated in
/home/devwp/public_html/p225-newweb/wp-content/themes/vsceptre/includes/builder/class-et-builder-element.php on line
1315
Deprecated: Creation of dynamic property ET_Builder_Module_Blog::$margin_padding is deprecated in
/home/devwp/public_html/p225-newweb/wp-content/themes/vsceptre/includes/builder/class-et-builder-element.php on line
1315
Deprecated: Creation of dynamic property ET_Builder_Module_Blog::$_additional_fields_options is deprecated in
/home/devwp/public_html/p225-newweb/wp-content/themes/vsceptre/includes/builder/class-et-builder-element.php on line
1315
Deprecated: Creation of dynamic property ET_Builder_Module_Blog::$_original_content is deprecated in
/home/devwp/public_html/p225-newweb/wp-content/themes/vsceptre/includes/builder/class-et-builder-element.php on line
1315
Deprecated: Creation of dynamic property ET_Builder_Module_Helper_MultiViewOptions::$inherited_props is deprecated in
/home/devwp/public_html/p225-newweb/wp-content/themes/vsceptre/includes/builder/module/helpers/MultiViewOptions.php on line
686
Deprecated: Creation of dynamic property ET_Builder_Module_Helper_MultiViewOptions::$inherited_props is deprecated in
/home/devwp/public_html/p225-newweb/wp-content/themes/vsceptre/includes/builder/module/helpers/MultiViewOptions.php on line
686
Deprecated: Creation of dynamic property ET_Builder_Module_Helper_MultiViewOptions::$inherited_props is deprecated in
/home/devwp/public_html/p225-newweb/wp-content/themes/vsceptre/includes/builder/module/helpers/MultiViewOptions.php on line
686
This is the final piece of the 3 part series “The path to your first SLO”.
We have discussed on the basics of what to observe and how to get the relevant metrics in part 1 and part 2 of this series. This time we are going to have a quick look on to setup a simple service availability monitoring SLO with Nobl9 and SolarWinds Pingdom.
Nobl9 is used for building the SLO dashboards in this example as it supports a lot of data sources input, with options to gather metrics through the Nobl9 agent or using direct API integration. To save some time, we use the SolarWinds Pingdom to run a script and monitor a web URL.
You can setup a free trial on SolarWinds Pingdom as well as Nobl9 for a 30 days trial. That will provide you with a nice playground on this exercise. Point this to an important service URL and runs a simple availability test on a per minute basis. SolarWinds PingDom will return up/time as well as a service response metrics for you.
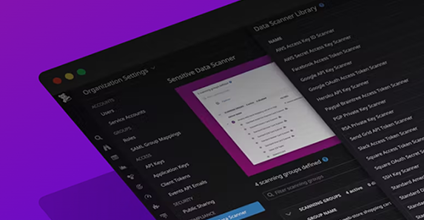
Setting up the data source in Nobl9 to connect to SolarWinds is a breeze. We do not want to repeat the details here. If you are interested, you can follow this nice tutorial. At the end you can get a nice dashboard similar to this.
We set a SLO target of 99% if the response time of this slow endpoint is within 8 seconds for a 1 day rolling window (Satisfactory). Another similar SLO target of 99% for response time within 6 seconds (Optimal). Based on above, we can comfortably commit and SLA to the end user for an SLA with response time < 8s for 99% of the time on a 1 day rolling window. At the same time leaving some room for system downtime or pushing new releases to the production.
This just scratched the surface of how to utilize SLO for service reliability tracking. You can also build composite SLO, setting alerts or changing the time windows of the SLO. Of course you can build all these dashboards with other tools but Nobl9 can make you life a bit easier. The whole process can be setup using SLO as code with Terraform or OpenSLO.
Hope you enjoy the series of “The path to your SLO”. If you have a need to revisit the observability practice feel free to reach out and talk to us. Our team of consultants from Vsceptre can help you on different aspects of your observability journey from monitoring, log aggregation, DevOps integration, SRE practice as well as data consolidation.
New to SLO?
#SLOconf is a free, virtual event focused on #SLOs! 🔥
Whether you are doing SRE, SLO, or DevOps, or Ops, or a Dev – SLOconf is the perfect platform to share insights and ideas on the latest trends and developments in SRE/SLO.
Vsceptre is a sponsor at SLOconf 2023, hosted by Nobl9! 📢
For more details & speaker lineup, register here: 👇
www.sloconf.com


